Designated Hitters vs Position Players: How Lineup Slots Move HR Odds
 Available in US
Table of Contents
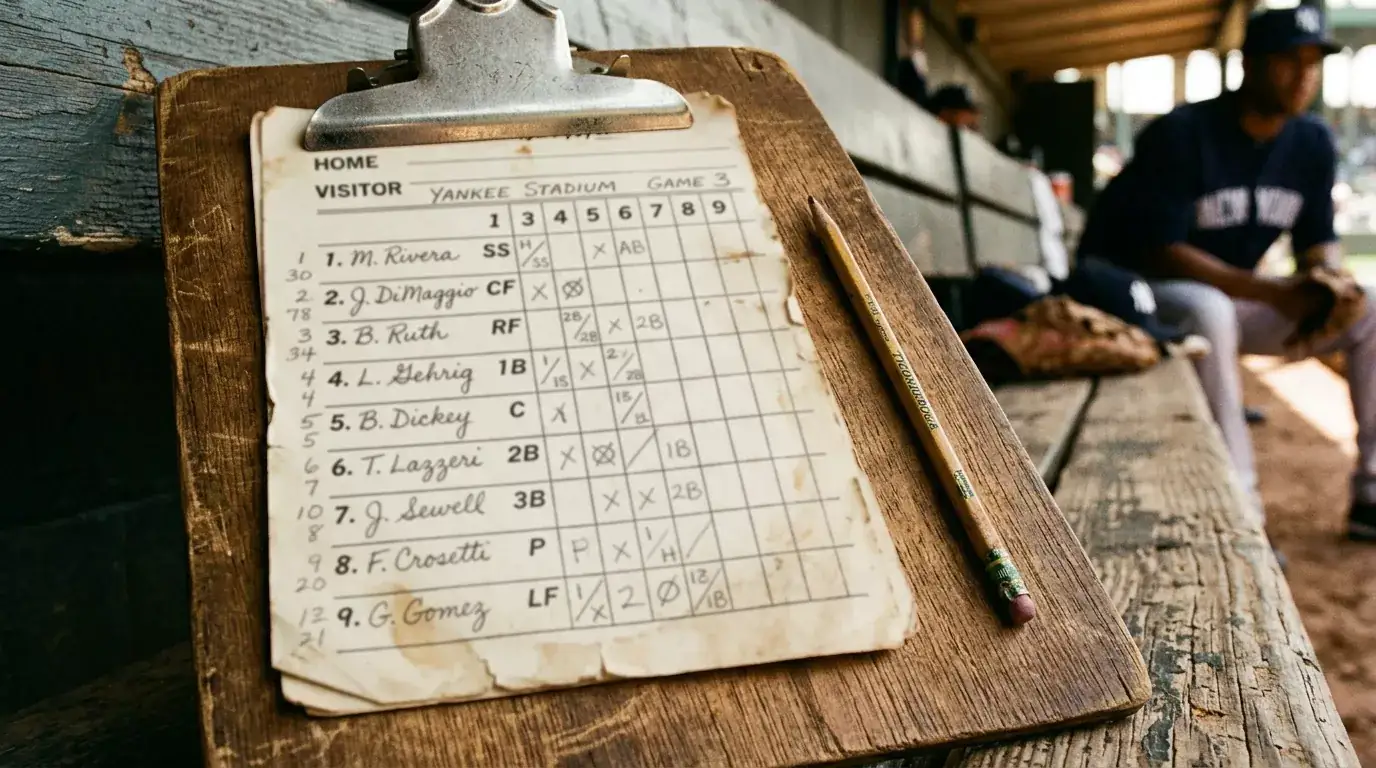
Lineup slot is the single most underdiscussed input on HR-prop pricing. Most punters look at the bat – the hitter’s underlying barrel rate, hard-hit rate, recent form – and stop there. The book does not stop there. The book also reads the lineup card, and the lineup card determines how many plate appearances the hitter is realistically going to get and what kind of count situations he will see. The interaction between role and slot is where a fair share of HR-prop pricing edge hides, and the difference between how the book prices a designated hitter and a position player at the same per-PA HR rate is often two or three ticks larger than it should be.
The PA Volume Problem
Per-game expected plate appearances vary more across the lineup than punters typically internalise. A leadoff hitter averages 4.5 to 4.8 PAs per game across a season. A two-hole hitter averages 4.4 to 4.6. By the time you reach the bottom third of the order, the average is 3.6 to 3.9. That means the difference between batting second and batting eighth, for the same player, is roughly one full plate appearance per game in expected terms.
For HR-prop pricing, that PA difference is huge. If a player has a 5% per-PA HR rate, his per-game HR probability is roughly 4.5 PAs times 5% – about 22.5%. If you drop him to 3.7 PAs the same probability drops to 18.5%. That is a 4-percentage-point difference in fair-value HR probability based on lineup slot alone, and it should translate to a 30 to 50 cent shift on the displayed moneyline price. The market does shift it, but often not by the right amount, especially when the lineup slot changes mid-season.
Where DH-Only Players Sit in This Picture
Designated hitters are usually slotted in the heart of the order – three, four, five – for two reasons. They are typically among the team’s better hitters, and they are not a defensive consideration so the manager can build the lineup around their bat. That mid-lineup placement gives them roughly 4.2 to 4.4 PAs per game across a healthy season – not the highest in the lineup, but solidly in the upper half.
The pricing advantage of a DH is not so much about volume as it is about stability. Position players occasionally drop in the order against tough opposing pitchers, against handedness mismatches, or for rest days. DH-only players tend to stay in the same slot game after game because the manager is not balancing defensive positioning. That stability means the to-hit-a-HR market for a DH-only bat is rarely surprising on lineup day, and the price reflects the expected slot reliably.
That makes DH-only HR props a relatively low-information bet – easy to price but also rarely mispriced. The market efficiency on these is comparatively high.
Where the Edge Actually Sits
The position-player side is where the inefficiency shows up. Consider a centre-fielder who normally bats sixth but moves up to third in the lineup against a left-handed starter, with the regular three-hole bat sliding down. That single-game lineup change might add 0.6 to 0.7 plate appearances to his expected total. His fair HR probability for that game shifts upward by roughly 3 to 4 percentage points, which is a 20 to 30 cent compression in the moneyline price.
Most operators do shift the line on confirmed lineup announcements, but the shift is often partial. The compression they apply is more in the range of 10 to 15 cents, leaving residual value on the new lineup spot. This is one of the most consistent intra-day edges I have found in HR-prop markets – backing position players who have moved up the order on the lineup card, when the price has not fully compressed.
The reverse also holds. A regular three-hole hitter who drops to seventh against a tough opposing starter has a fair price that should widen by 30 to 50 cents on the moneyline. The market often only widens it by 15 to 20. Fading a hitter who has been moved down the order on the lineup card is the cleanest under-direction edge in this market.
Reference Performance for the Top of the Lineup
To anchor the discussion in concrete production: Cal Raleigh led MLB in 2025 with 60 home runs while batting through a mid-order role for the Mariners – the all-time record for a catcher, switch-hitter, and the Mariners franchise. His PA volume was on the lower end for a position-player slugger because of the catcher rest schedule, which makes his absolute HR total even more remarkable. The implication for pricing is that a hitter who maintains an elite per-PA HR rate even in lower-volume slots – through rest days, lineup demotions, or late-game pinch-hit appearances – is a genuinely undervalued profile.
The other reference point: Shohei Ohtani in 2025 produced 55 home runs with a 58.4% hard-hit rate, the second-highest in MLB. Ohtani slots in the three-hole at home for the Dodgers – a high-volume slot that compounds his per-PA HR advantage into total volume. His pricing reflects that compound; Raleigh’s, partially priced in 2025 and tightening into 2026, still does not fully reflect his per-PA advantage despite his lower-volume role.
Lineup Confirmation Timing
One practical edge is timing your bets relative to lineup confirmation. MLB lineups are typically posted three to four hours before first pitch. Books sometimes do not refresh their HR-prop pricing for 30 to 60 minutes after lineup announcement, especially on lower-profile games. That window is where the cleanest edge lives. Taking a moved-up bat at his pre-lineup-announcement price, or fading a moved-down bat at the same, captures value before the books catch up.
The window narrows over time as books improve their pricing engines. Five years ago the window was hours; now it is closer to half an hour. By 2027 I expect it to be minutes for the major operators. For now, in 2026, it remains a real if shrinking edge.
Platoon Splits and Lineup Slot Together
The compound case is when lineup slot and platoon match align. A right-handed power hitter moves up the lineup against a lefty starter – his fair HR probability shifts upward both from the additional PAs and from the platoon advantage. That double effect is rarely fully priced. The market tends to apply one adjustment cleanly and the other partially, leaving residual value.
The same logic in reverse applies to a hitter dropped against an unfavourable platoon match. The PA reduction and the platoon disadvantage compound, and the line widening is usually under-applied. Fading a moved-down hitter who is also platoon-disadvantaged is one of the cleanest under-direction bets in HR-prop markets.
The Catcher Position Special Case
Catchers warrant a quick digression because their lineup positioning interacts with rest schedules in a unique way. They typically bat sixth or seventh in the lineup, get fewer PAs per game than corner-outfield power bats, and sit about one game in five for rest. That triple structural drag on their HR-prop pricing is the same drag that produces the catcher discount I have written about elsewhere – and the elite catchers who outperform that drag are the most consistently undervalued profile in HR-prop markets.
The connection between catcher pricing and lineup-slot pricing more broadly is the same theme: how an elite catcher slugger like Cal Raleigh exposes the pricing gap on lower-volume mid-order slots ties the catcher-specific dynamics into the broader lineup-slot framework.
How I Apply This Daily
My pre-bet workflow on HR props now starts with the lineup card before it touches the bat profile. I check whether the player is in his usual slot, whether the slot ahead of him in the order is set or shifted, and whether anything in the day’s lineup changes the expected PA count meaningfully. If the slot has moved, I calculate the rough PA delta and the corresponding fair-price shift, then check the actual displayed price. If the gap between the displayed price and my fair estimate is at least 20 to 30 cents on the moneyline, the bet is on my list. If not, I move on.
That workflow takes about ten minutes per game and consistently surfaces bets that the standard “screen by hitter quality” approach misses. The pure power profile screen captures who can hit a home run; the lineup-slot adjustment captures whether tonight is the night the underlying probability lines up with the displayed price.
Slot as a Persistent Input
The bigger lesson, beyond the day-by-day tactics, is that lineup slot is not a one-time adjustment to apply to a hitter’s seasonal price. It is a daily input that varies with the matchup, with the manager’s roster decisions, and with the platoon configuration. Treating slot as a fixed property of the hitter – assuming the leadoff hitter always leads off, the three-hole hitter always bats third – is one of the most expensive simplifications a punter can make.
The book does not make that simplification. The sharpest punters do not either. The structural edge sits in being just slightly more granular than the average prop bettor about lineup mechanics, and that edge has been a stable contributor to my long-run HR-prop results.
Do DH-only players get steeper HR prices?
Mildly, in the sense that they slot reliably in the heart of the order and benefit from above-average PA volume. The bigger pricing dynamic is stability – DHs almost always bat in the same slot game after game, so their pricing is consistent and rarely surprising. The market efficiency on DH-only HR props is comparatively high; the inefficiencies show up more on position players whose slots vary.
How much does a one-slot lineup change shift fair HR probability?
Roughly 0.3 to 0.4 plate appearances per game per slot, depending on the team’s run environment. For a hitter with a 5% per-PA HR rate, that is a 1.5 to 2 percentage point shift in fair HR probability. The corresponding moneyline shift is 10 to 20 cents per slot. The market often applies smaller shifts than this when the lineup change is announced just before the game.
When is the best window to bet lineup-slot moves?
The 30 to 60 minutes immediately after MLB lineup announcement, which is typically three to four hours before first pitch. Books sometimes lag in updating HR-prop prices when a hitter has moved up or down the order, especially on lower-profile games. That window is where the cleanest edge lives – capturing the lineup-driven price shift before the book catches up.
Created by the ”mlb Prop Bets Home Runs” editorial team.