Coors Field at 5,280 Feet: The Altitude Math Behind Denver Home Runs
 Available in US
I once made a small fortune on a single Coors Field afternoon doubleheader by doing nothing more sophisticated than backing every middle-of-the-order hitter to homer at standard prices. It was a 32°C July day, the wind was light and out, and the Rockies were hosting the Reds. I cashed seven of nine HR tickets across the two games, walked out of the day with more profit than the previous three weeks combined, and learnt nothing useful about my own betting skill. What I learnt instead was that Coors Field is genuinely different from every other ballpark in baseball, and that the punter who treats it as just another stadium is missing the single most predictable HR environment in the sport. Eleven years later, my approach to Coors is the same as it was that afternoon: respect the altitude, ride the maths, and never overcomplicate what the air is doing for you.
Why Denver Plays Like a Different Sport
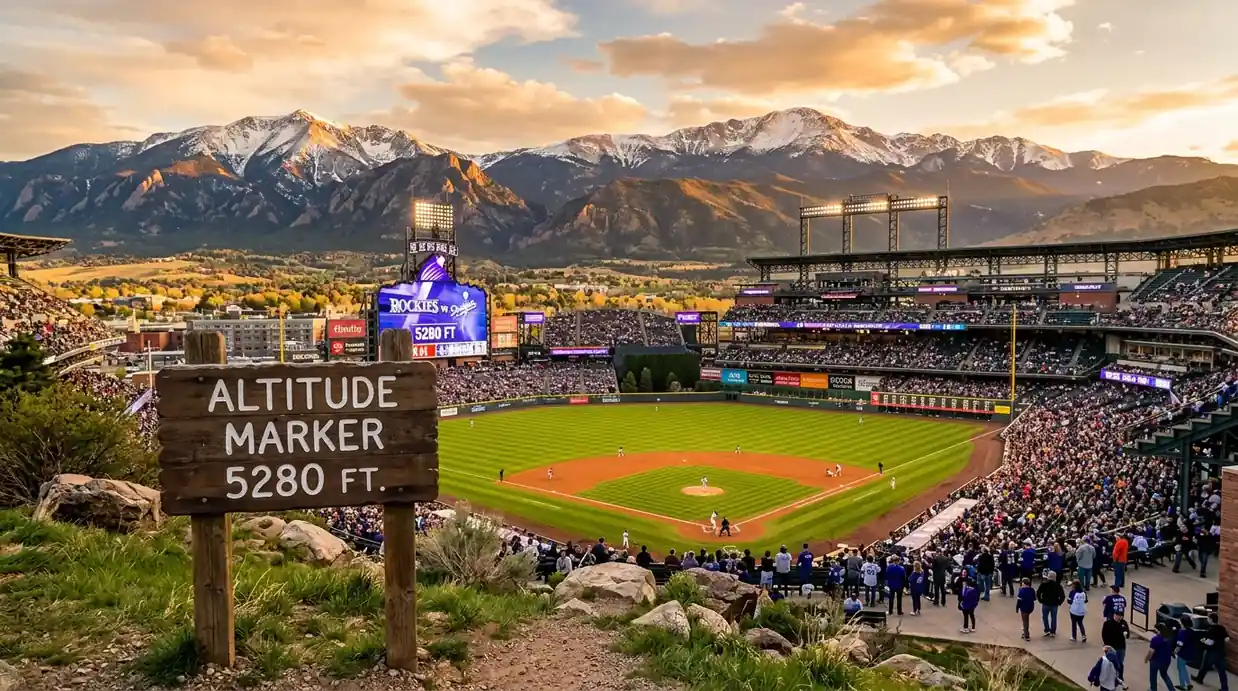
Coors Field’s nickname among analysts is “the launching pad”, and the reason is purely physical. The stadium sits at 5,280 feet (1,609 metres) above sea level, which increases ball flight distance by approximately 9% compared to sea level. That 9% is not a marketing approximation – it is a measured aerodynamic effect, derived from the reduced air density at altitude. The math runs straight through every fly ball: less air resistance, less drag, more distance for the same exit velocity and launch angle.
To put it in concrete terms, a fly ball that travels 400 feet at Yankee Stadium will travel approximately 408 feet at Atlanta’s Truist Park and up to 440 feet at Coors Field. That 40-foot gap between New York and Denver is not a tweak. It is the difference between a routine warning-track out and a no-doubt home run that lands halfway up the bleachers. Players who would struggle to reach 380 feet at sea level can occasionally clear the wall in Denver. Players who reach 380 feet routinely become 410-foot threats. The whole hitter pool shifts up a tier.
For a UK punter trying to picture the magnitude, the analogy is hitting a six in cricket on a hard pitch versus a slow one. In baseball, the equivalent variable is the air, and Denver is the slowest pitch in the sport.
The Density Math That Makes the 9 Percent Real
Air density at sea level sits at roughly 1.225 kilograms per cubic metre. At 5,280 feet, atmospheric pressure is about 17% lower, and the resulting air density falls to roughly 1.013 kilograms per cubic metre – about 83% of sea-level density. That density drop reduces the drag force on a flying baseball proportionally. Less drag means less deceleration over the trajectory, and the ball retains more of its initial velocity throughout flight.
The 9% distance increase is not directly proportional to the density drop because of second-order effects from spin and gravity. But for practical betting purposes, the 9% figure has held up across decades of empirical observation and is reliable enough to plug straight into a probability model.
What this means in calculator terms: if a hitter has a 22% per-game home run rate at a sea-level park, his rate at Coors Field – adjusting only for altitude, all other variables held constant – is closer to 28%. That is six percentage points of additional probability, which converts to a meaningful price difference on the line sheet. A slugger priced at +275 in his home park is closer to +180 fair value at Coors. The line typically does adjust, but rarely fully, because the trader has to balance the altitude effect against pitcher quality and recent form, and the public bias toward fading “altitude scores” creates additional drift.
Where the Common Mistake Lives
The most expensive misconception about Coors is that it inflates HR probability uniformly across the lineup. It does not. The altitude effect benefits hitters in proportion to their existing fly-ball profile. A hitter who already produces a high rate of fly balls at the right launch angles gets the full 9% distance bonus on his already-credible home run threats. A hitter who produces ground balls and weak fly balls gets very little – the altitude does not turn ground balls into home runs.
This is why I focus my Coors plays on hitters with strong barrel rate and 90th-percentile exit velocity profiles, not on traditional power hitters with high HR totals. A 220-pound corner outfielder who runs a 6% barrel rate and 105 mph 90th-percentile exit velocity gets meaningful uplift at altitude. A 250-pound first baseman who runs a 4% barrel rate and 102 mph 90th-percentile exit velocity does not benefit much, because the contact quality required to leverage the altitude isn’t reliably there.
The corollary is that pitchers’ HR rates allowed at Coors are massively inflated, and the ones who pitch there most often (Rockies starters) have stat lines that look horrendous. Knowing how to read those numbers is its own art. A Coors-based pitcher with 1.50 HR/9 might be league-average in true skill, while a sea-level pitcher with the same line is genuinely problematic. For HR-prop bettors, this matters when a Rockies starter pitches on the road – his road numbers are usually meaningfully better than his Coors-inflated home numbers, and the market sometimes prices him on the season aggregate rather than the road split.
The Weather Stack at Altitude
Altitude does not work alone. It compounds with temperature and humidity, and in Denver’s specific climate the stack is potent. Summer afternoons routinely sit at 28 to 32°C with low relative humidity. The temperature alone adds another layer of distance – approximately 1.96% additional home runs per °C of warmer-than-average temperature – and dry air at altitude amplifies the density effect.
The cumulative effect of a hot dry summer afternoon at Coors Field is the most home run-friendly environment in major league baseball. By my estimates, a 30°C afternoon with light tailwind at altitude can push fly-ball distance roughly 14% beyond a still 70°F sea-level baseline. That single number changes the lineup math meaningfully – even mid-tier power threats become viable HR plays at conditions like that.
The interaction with temperature is what makes Coors a particularly seasonal park for prop bettors. April games at Coors, when Denver afternoons can sit in the low teens Celsius, are a different bet from July games. The altitude effect remains, but the temperature suppression partially cancels it. The line sheet often does not differentiate between a 14°C April Coors game and a 30°C July Coors game with the appropriate weight, and the bettor who prefers the warm dates is harvesting an underappreciated edge. The deeper writeup on why Dodger Stadium leads the 2024 to 2026 park factor charts at 129 covers a contrasting case where the altitude variable is absent and the climate signal is the dominant driver.
Why Coors Is Not Always the Auto-Bet It Looks
The trap of Coors Field is that the obvious play has been the obvious play for thirty years. Every casual punter with a passing knowledge of baseball knows about the altitude. The market knows. The trader knows. The lines reflect a meaningful chunk of the altitude premium already, and unthinkingly betting every Coors HR prop is a quick way to feed the bookmaker’s hold without earning a long-run profit.
The edge at Coors lives in two specific places. The first is platoon-specific mismatches. The altitude effect is uniform across the field, but the ballpark dimensions favour different sides at different parts of the day. Late-afternoon shadows on Coors’s right field can cool fly-ball flight on that side relative to centre and left, and a left-handed pull hitter who needs every foot of carry can be a marginal play even when the temperature suggests otherwise. The right-handed slugger pulling to left field at 1pm in July is a different bet from the left-handed slugger pulling to right at 4pm in cooler shadow.
The second is pitcher quality. The Rockies’ staff is built around contact suppression because home runs are inevitable at altitude. Visiting pitchers vary. A visiting starter who relies on a fly-ball slider for his put-aways is going to leak home runs at Coors that he keeps in the yard at sea level. A sinker-baller who keeps the ball on the ground transports better to altitude. Identifying the visiting pitcher’s profile is more important than identifying the hitter’s, because every Coors hitter is going to do somewhat better than usual; the question is whether the pitcher’s specific weakness gets exposed on the night.
The Stake Discipline That Coors Requires
The variance at Coors is, counter-intuitively, higher than at most parks. The altitude pushes more fly balls into the home run zone, but the specific outcome on any given ball still depends on exit velocity, launch angle, and the wind. The result is more home runs leaguewide, distributed more evenly across the lineup, with less concentration in the predictable sluggers. That makes individual HR-prop tickets at Coors slightly less reliable than the overall HR rate suggests – you are betting on a higher base rate but a more diffuse distribution.
My personal rule is to size Coors HR tickets at the same level as my standard sea-level plays, not larger. The temptation to bet up because the environment is hitter-friendly is real, and it is wrong. The price has already absorbed the environmental advantage. Sizing larger because of the altitude is essentially paying twice for the same edge. Stick to your standard staking, take the modest probability uplift the lines fail to fully price, and accept that Coors is a productive but not transformational hunting ground.
I will offer one specific tactical note. Two-homer alternate lines at Coors are a very different bet from two-homer alternate lines anywhere else. The base rate for multi-homer games at altitude is materially higher than the league average, and the alternate lines often do not adjust enough. A slugger who is +1400 to homer twice at his sea-level home park might be +1100 at Coors, but the true probability is closer to +800. That is the cleanest single edge I have found at this venue.
The Slow, Steady Lesson That Took Me Years to Learn
The first time I bet a Coors slate I cleaned up. The second time I lost half my profits trying to repeat the trick. The third time I learnt to be patient – to bet only the matchups where the visiting pitcher’s profile compounded with the altitude rather than fighting it, where the temperature was firmly in the warm band, and where the hitter’s underlying contact quality could leverage the environment. That patience cost me some apparent winners and saved me from many losers, and the long-run record on my Coors plays is now reliably positive at a margin that holds across seasons. The lesson, if there is one, is that no environment in baseball gives you a free profit. The altitude gives you a real probability shift. Whether you turn that shift into money depends entirely on the discipline you bring to the rest of the analysis.
How much does altitude at Coors Field add to a fly ball?
Approximately 9% additional distance compared to sea level, derived from the reduced air density at 5,280 feet of elevation. A 400-foot fly ball at Yankee Stadium becomes a roughly 440-foot fly ball at Coors Field. That extra carry is enough to convert many warning-track outs into clear home runs, which is why Coors has the most consistent home run-friendly environment in MLB.
Are Coors Field home run props always good value?
Not automatically. The market has been pricing Coors’s altitude effect for decades, and most of the obvious uplift is already baked into the line. The remaining edge sits in matchup specifics – visiting pitchers whose pitch mix produces fly-ball contact, hot summer afternoons that compound altitude with temperature, and platoon-aligned hitters whose pull-side benefits from the day’s shadow patterns. Selective betting at Coors outperforms blanket betting.
Published by the mlb Prop Bets Home Runs team.