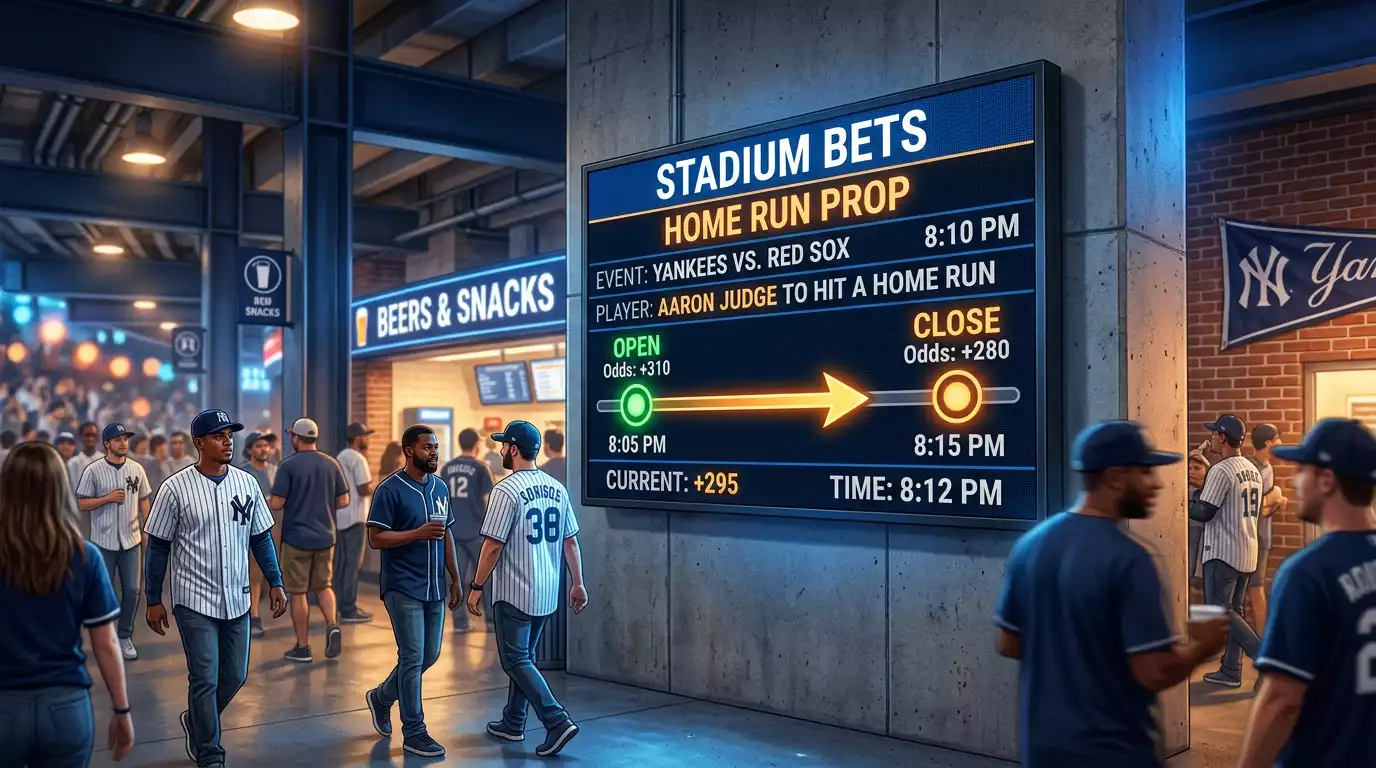
Calculating EV on Home Run Props: A Math-First Walkthrough
 Available in US
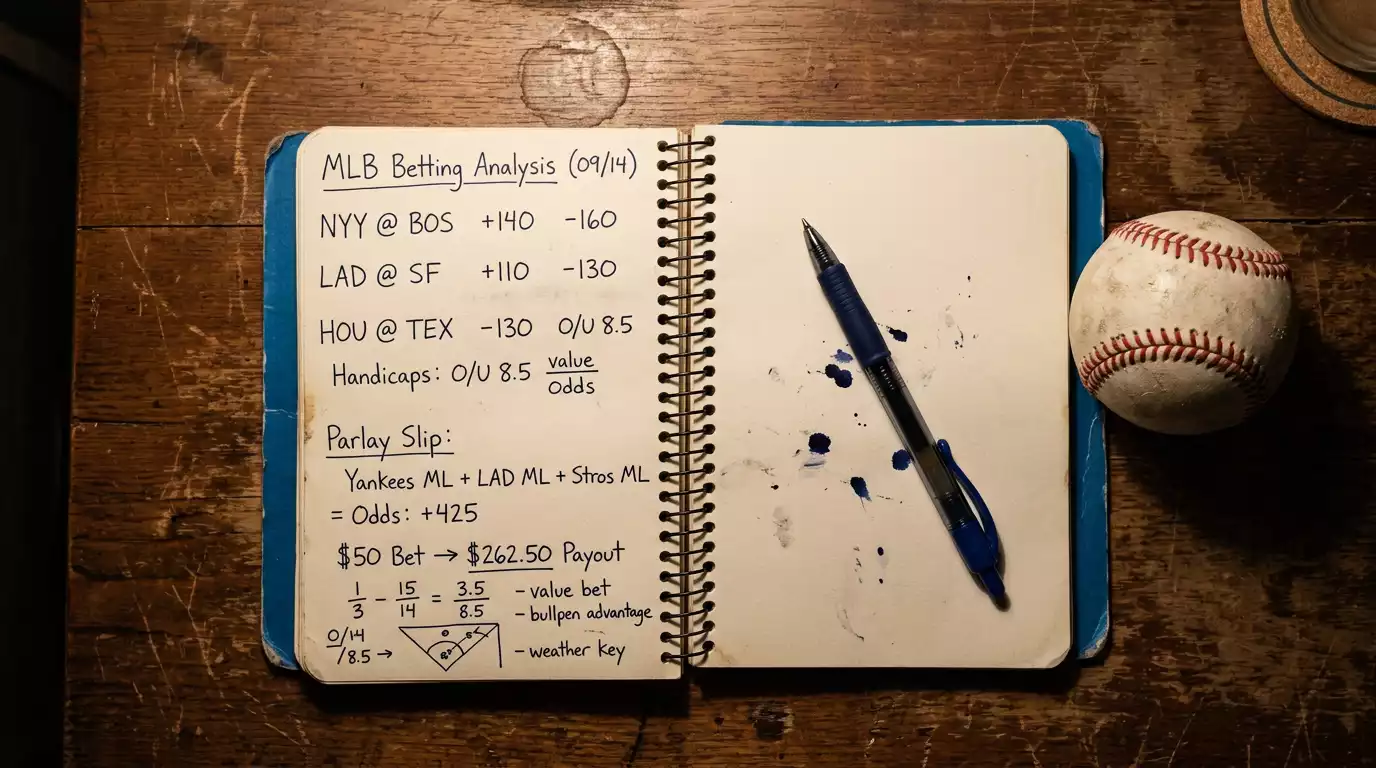
The first time I sat down with a spreadsheet to calculate expected value on home run props, I lost a Saturday afternoon and most of my faith in my own betting decisions. I had been profitable on standard HR markets for a year, mostly through gut feel and a working knowledge of park factors. When I converted my last hundred tickets into proper EV figures, I discovered that I had been positive on the slate-leading sluggers and negative on everything else, by a margin that almost exactly cancelled out. My profit was an illusion built on the books occasionally pricing the elite hitters wrong, and on me bumping into those mispricings by accident. That afternoon was when I stopped guessing and started counting.
What EV Actually Means When You Strip the Jargon
Expected value is a pretentious phrase for a simple question. If you placed the same bet a thousand times in identical conditions, would you finish ahead or behind? That is it. The answer depends on two numbers: how often you think you would win, and how much the book pays you when you do. If your true probability is higher than the book’s implied probability, you are positive EV. If it is lower, you are negative EV. The size of the gap, multiplied by your stake, tells you how much you should expect to make or lose per bet on average.
The formula written cleanly looks like this. EV equals true probability times potential profit, minus loss probability times stake. If a book offers +400 on a slugger to homer, the implied probability is 20%, and the potential profit on a £10 stake is £40. If you genuinely believe the player is closer to 25% to go deep, your EV calculation is 0.25 times £40 minus 0.75 times £10, which equals £10 minus £7.50, or £2.50 of expected profit per ticket.
That £2.50 is the number that matters. It tells you the bet is worth taking, and roughly how much edge you have. A £2.50 EV on a £10 stake is 25% – exceptional, the kind of number you find a few times a season on truly mispriced lines. Most playable props will give you 5% to 10% EV, which sounds tiny but compounds into real money across a season of disciplined betting.
The Step Most Punters Skip: Calibrating Your Probability
The maths is the easy part. The hard part is the probability estimate, and this is where 90% of recreational punters quietly torpedo their own bankroll. Walking into a market with a vague feeling that “this guy looks good tonight” is not a probability estimate. You need a number, and you need to be honest about how you arrived at it.
My process is deliberately mechanical, because emotion in this part of the workflow is poison. I start with a baseline per-game HR rate for the player. For a top slugger that might be 6% per plate appearance, which translates to roughly 24% per game across four PAs. In 2025 Cal Raleigh hit 60 home runs across 152 starts – a per-game HR rate of 0.395 – and Shohei Ohtani put up 55 home runs while running a 58.4% hard-hit rate, second in MLB. Those are the upper bounds for elite power. Most playable bats sit in the 18% to 28% per-game range as their starting baseline.
From the baseline, I apply multiplicative adjustments. Park factor first – at Dodger Stadium I bump the rate by 29%, at PNC I cut it by 34%. Pitcher adjustment second, based on the starter’s career HR/9 against the relevant batter handedness. Weather third – temperature, humidity, wind direction. Lineup slot fourth, accounting for expected plate appearance volume. By the time I reach the final number, I have a probability estimate that is defensible, repeatable, and immune to the slugger’s recent home run highlight reel making me feel like he is “due”.
How the Implied Probability Trap Works
Now turn the equation around. The book offers you +400. What probability does that price imply? Convert American odds to implied probability with a straightforward formula: 100 divided by the sum of the absolute odds value plus 100. So +400 becomes 100 divided by 500, which is 20%. DraftKings voids a home run prop entirely if the player does not appear in the starting lineup, while FanDuel keeps the bet active for any plate appearance, including a pinch-hit cameo – and these settlement differences quietly affect the true probability you should be working with on each book, but the implied probability of the price stays the same.
The implied probability is what you would need the player’s true HR rate to be for the bet to break even at that price. If your model says he is 20% or lower, you are taking a coin-flip with extra steps. If your model says he is 25% or higher, the price is paying you for the risk you are taking, and the bet is profitable in the long run.
Here is the cruel part. The standard public bookmaker hold on home run props sits between 4% and 6%. That is the baked-in margin you are climbing every time you place a bet. To beat the market across a season, your probability estimates need to be more accurate than the trader’s by at least that margin, on average. Most punters never get there, because they rely on memory, narrative, or recent performance rather than a structured model. The good news is that the trader’s model is not magic – it is a slightly more disciplined version of what you can do at home with a spreadsheet and a few hours of weekly maintenance.
One veteran analyst put it crisply: “There’s more variance with HR bets than with traditional baseball wagers, so you’ll need to practice proper bankroll management”. That is not a throwaway line. It is the practical implication of working with low-probability events. Even a +EV ticket loses three out of four times, and your staking has to absorb that pattern without putting your bank in danger.
A Worked Example From a Tuesday Slate
Let me run through an actual calculation in the way I do it on a midweek slate. Player: a left-handed slugger I will not name, batting third, against a right-handed starter at Yankee Stadium. The book lists him at +275 to hit a home run.
Step one, baseline. The hitter has been running a 5.5% per-PA HR rate over his last sixty games. Expecting roughly four PAs, his per-game baseline is 22%.
Step two, park. Yankee Stadium plays roughly +12% for left-handed hitters because of the short porch in right field. The adjusted rate climbs to 24.6%.
Step three, pitcher. The starter has allowed 1.6 HR/9 to lefties over the last two seasons, which is hot. The matchup-specific rate adjusts up by another 8%, taking the figure to roughly 26.6%.
Step four, weather. The forecast shows 24°C with a 7 mph wind blowing out to right field. Temperature alone adds about 2%, and the wind adds another 4% to a left-handed pull hitter. The probability climbs to 28.6%.
Step five, lineup. The batter is hitting third in a strong order, so PA volume is solid. No further adjustment.
Final probability estimate: 28.6%. Implied probability at +275: 26.7%. Edge: 1.9 percentage points. EV on a £10 stake: 0.286 times £27.50, minus 0.714 times £10, which equals £7.87 minus £7.14, or £0.73. About 7.3% return per ticket.
That is a marginal but genuine play. I would take it, but at small stake. The edge is too thin to feel comfortable sizing up, and the variance is high enough that across ten of these tickets I might cash three and feel like I am losing money even when the maths says I am profiting. Patience and stake discipline carry the day.
The Common Mistakes That Sabotage Your Numbers
The most damaging mistake I see is double-counting park factor. A punter sees Dodger Stadium, bumps their probability up by 29%, then looks at the player’s recent stats – which include several games at Dodger – and bumps the probability up again because the player has been hot lately. The hot streak is partly a function of having played at Dodger. You are baking the same adjustment in twice and inflating your edge artificially.
The second mistake is using sample sizes that are too small. A pitcher who has allowed three home runs to lefties in his last forty plate appearances is not necessarily soft against lefties – he might just have run into a small sample of fly-ball results. I require at least 200 PAs of relevant matchup data before I trust a starter’s split, and I will fall back to overall numbers if the split sample is not robust.
The third mistake is ignoring lineup PA volume. A slugger batting fifth on a team that grinds out long innings might get a fifth plate appearance more often than a slugger batting second on a team that gets retired in order. The PA distribution matters and it is hard to model perfectly, but ignoring it entirely costs you accuracy on every ticket.
If you want to build the input layer of this model – specifically the launch-angle data that drives the expected HR rate – the explainer on why the 26 to 30 degree window is the sweet spot is the natural next read.
The Discipline That Turns Theory Into Profit
Expected value is not a magic spell. Knowing the maths does not guarantee a winning season – it guarantees that if you are willing to do the work, your decisions stop being random. Most punters never make that switch because the work is genuinely tedious. Building a probability model means tracking park factors, weather feeds, pitcher splits, and lineup volume across hundreds of games, and updating the inputs every week. It is unglamorous, it is slow, and it is the only durable edge available to a non-professional bettor in a market that is increasingly dominated by trading desks with quantitative staff. The good news is that the books still misprice often enough that a careful amateur with a clean spreadsheet can find genuine edges. The bad news is that you have to actually do the work. There is no shortcut.
What is expected value in the context of a home run prop?
Expected value is the average profit or loss per bet across a long run of identical wagers. It is calculated by multiplying your true probability of winning by the potential profit, then subtracting your loss probability multiplied by the stake. Positive EV means the bet is profitable in the long run; negative EV means the bookmaker is winning. The challenge is producing accurate probability estimates that beat the market consistently.
How do I find positive EV home run props in practice?
Build a probability model for each player using a baseline per-PA HR rate, then apply multiplicative adjustments for park factor, pitcher matchup, weather, and lineup slot. Compare your estimate to the bookmaker’s implied probability – if yours is higher by more than the book’s hold of around 4 to 6%, the bet is genuinely positive EV. Stake size should reflect the size of the edge, not the size of the potential payout.
Created by the ”mlb Prop Bets Home Runs” editorial team.