Launch Angle Sweet Spot: Why 26 to 30 Degrees Sells Tickets
 Available in US
Table of Contents
- What a Launch Angle Actually Is
- The 26 to 30 Degree Magic Window
- Why Some Hitters Live In the Sweet Spot and Others Don’t
- Pitcher-Side Influence on the Launch Angle Profile
- The Common Mistake of Confusing Average and Optimal
- Weather and Park Magnify the Launch Angle Signal
- Why The Math Always Wins Eventually
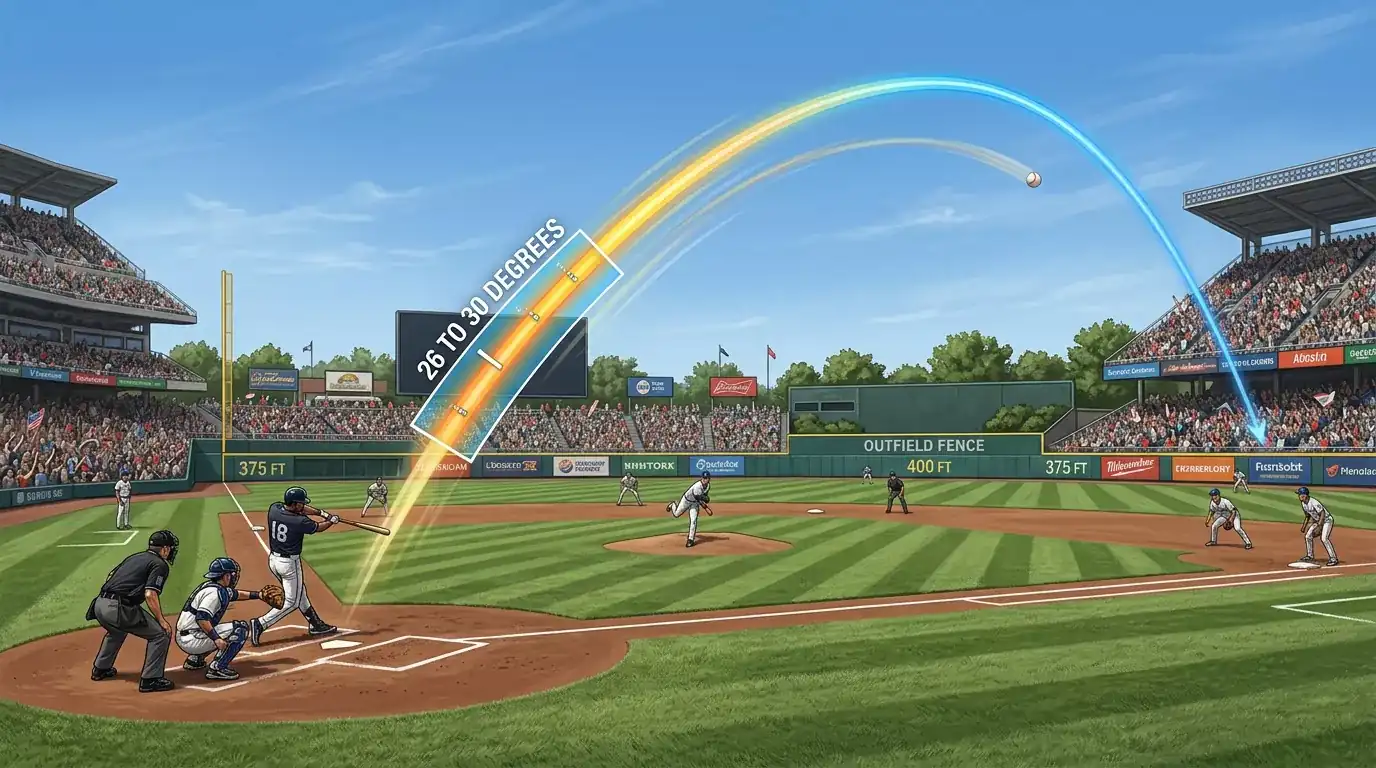
I had a long argument with a friend at a pub in Camden a few summers ago about why some hitters seem to homer constantly even though their exit velocity is nothing special. He kept insisting it was “swing path” and I kept insisting it was raw power, and we were both half right, which is the most annoying way to lose an argument. The bit we were both missing was launch angle, and specifically the narrow window between roughly 26 and 30 degrees where the physics of the baseball quietly turns marginal contact into the pure clean home run that travels 410 feet without anyone watching feeling like it should have. Once you understand what is happening in that four-degree band, half the mystery of the home run prop market evaporates.
What a Launch Angle Actually Is
The simplest way to picture it is to imagine a horizontal line drawn through the batter’s belt buckle at the moment of contact. The launch angle is the angle between that horizontal line and the trajectory of the ball as it leaves the bat. A flat line drive sits at zero degrees. A pop-up to the catcher might be 70 degrees. A ground ball is negative. The whole behaviour of the batted ball – distance, hang time, hit probability – depends on this single number more than almost any other variable.
Statcast has been measuring launch angle since 2015, and the data has rewired how analysts and front offices think about hitting. The quick story is that home runs cluster in a remarkably narrow window. Fly balls below 22 degrees tend to die at the warning track because they do not get enough hang time. Fly balls above 35 degrees become high-arc easy outs because they decelerate too much in the air. The sweet spot for distance is in between, and the further into that window a ball is hit, the more aggressively distance compounds.
Statcast has its own definition of “sweet spot rate” that is broader than what I am describing. Statcast’s official sweet-spot rate is the percentage of batted balls with launch angle between 8 and 32 degrees. That window includes hard line drives and quality fly balls – anything that is not a ground ball or a popup. It is a useful general-purpose stat but not specific enough for HR-prop bettors. We need to look closer at the upper half of that range, where the homers actually live.
The 26 to 30 Degree Magic Window
Here is the bit that matters. A barrel in Statcast is defined as a batted ball with minimum exit velocity of 98 mph; at exit velocity 98 mph, balls struck at launch angles between 26 and 30 degrees are always classified as barrels. The reason that exact window exists in the formal definition is that the physics of ball flight produce a strong distance peak in those four degrees. At 98 mph and 28 degrees, a struck ball travels close to its maximum possible distance, given the variables of air resistance and gravity working against it.
For a UK reader who has played cricket but not baseball, the analogy is the lofted shot over the bowler’s head. There is a launch angle that produces maximum distance – too low and the ball drives forward and dies, too high and it skies up and comes down inside the boundary. Baseball is the same physics with a smaller bat and a 90-foot distance to clear. Hitters who consistently produce contact in the 26 to 30 degree window are not stronger than their peers – they are more efficient at converting their contact into the geometry that maximises distance.
That efficiency is what separates the elite home run hitters from the merely strong ones. Shohei Ohtani in 2025 ran a 58.4% hard-hit rate, second in MLB only to Schwarber’s 59.6%, but the reason he hit 55 home runs while Schwarber hit 56 is not just that they hit the ball hard. Both of them spend more of their air-ball contact in the 26 to 30 degree corridor than their peers do. The exit velocity gets the headlines. The launch angle does the work.
Why Some Hitters Live In the Sweet Spot and Others Don’t
The difference between a hitter who runs a high barrel rate and a hitter who runs a low one is mostly mechanical, and it is partially a swing-path choice. Hitters who swing slightly down on the ball tend to produce ground balls and low line drives, which are great for batting average but terrible for home runs. Hitters who swing slightly up – what coaches now call “matching the plane of the pitch” – produce more contact in the 20 to 35 degree range, with the upper half of that range converting into home runs.
The shift in approach over the last decade has been remarkable. A decade ago, the median MLB hitter swung close to flat. Today, most lineups feature multiple hitters who deliberately aim for the 25 to 30 degree corridor. The result is a leaguewide rise in home runs, but also a rise in pop-ups and strikeouts, because the same swing that catches a 96 mph fastball at 28 degrees can miss the same pitch entirely or skywall it at 50 degrees.
For HR-prop bettors, the practical implication is that hitters with high barrel-per-batted-ball rates are not lucky. They are mechanically built to find the sweet spot more often than their peers. That signal is more durable than home run rate over a small sample. A hitter with a 12% barrel rate over 200 batted balls is probably going to maintain it; a hitter with a 6% barrel rate who has gone 8-for-his-last-30 and slugged a few homers in the heat is probably regressing back to his real shape soon.
Pitcher-Side Influence on the Launch Angle Profile
Launch angle is not just about the hitter. The pitcher influences it heavily. A pitcher who throws elevated four-seam fastballs at the top of the zone produces fly-ball contact, because hitters tend to swing under high pitches. A pitcher who works at the knees with sinkers and breaking balls produces ground ball contact, because hitters swing over low pitches. The same hitter facing two different pitcher profiles will produce two completely different launch angle distributions, and his HR rate will move accordingly.
This is why I always check the opposing starter’s pitch mix before betting on a hitter’s HR prop. A high barrel-rate hitter facing a pitcher who lives at the knees with a 60% sinker rate is going to produce ground balls regardless of his swing path. The matchup nullifies his structural advantage. Conversely, a moderate barrel-rate hitter facing a starter who works elevated four-seamers in the zone is going to get pitches that match his uppercut, and his probability of finding the sweet spot for that night is meaningfully higher than his seasonal numbers suggest. The deeper read on opposing pitcher profile sits in the writeup on exit velocity thresholds and what they actually predict, where the same Statcast philosophy applies from the contact-quality angle.
The Common Mistake of Confusing Average and Optimal
One of the worst habits I see among amateur bettors is reading “average launch angle” stats off a player profile and treating them as predictive. A hitter with an average launch angle of 12 degrees is not necessarily a poor home run prospect – he might be a hitter who produces tons of line drives at 8 to 18 degrees with the occasional 30-degree fly that goes 420 feet. The average masks the distribution.
What you want is the percentage of batted balls in the 25 to 35 degree window specifically, plus the average exit velocity in that window. Those two figures together tell you how often the hitter finds the home run zone and how hard he hits it when he does. A hitter who lives at 6% in the window but averages 105 mph on those balls is a more reliable home run threat than a hitter who lives at 10% in the window at 95 mph, because the harder-hit balls are far more likely to clear fences regardless of park.
Most of the public Statcast tools surface this if you know where to look. Search for “launch angle distribution” rather than “average launch angle” and you will find the percentile breakdowns that actually matter. The hitters who consistently produce 8% or higher contact rates in the home-run window are the ones I keep on my preferred list, regardless of where they sit on traditional power-hitting leaderboards.
Weather and Park Magnify the Launch Angle Signal
The cleanest illustration of how launch angle interacts with environment is what happens at high altitude. Coors Field sits at 5,280 feet (1,609 metres) above sea level, which increases ball flight distance by approximately 9% compared to sea level. That 9% is roughly equivalent to a 30-foot boost on a fly ball that would have gone 380 feet at sea level. That extra distance lets balls struck at sub-optimal launch angles – 22 degrees, say, when 28 would be ideal – still clear fences they would otherwise have died short of.
The same principle works in reverse. At a sea-level park with cold dense air, a ball hit at 26 degrees might just clear the fence; in 95-degree heat at the same park, the same ball might fly 20 feet beyond. The launch angle did not change, but the air did. The window of “playable” launch angles widens at hitter-friendly parks and narrows at pitchers’ parks, which is part of why park factor multiplies HR rates so dramatically.
For a bettor, the takeaway is that the same hitter on the same swing produces wildly different HR probabilities depending on where he is and what the weather is doing. A hitter with average barrel rate at Dodger Stadium on a warm afternoon is essentially a different bet from the same hitter at Petco on a 13°C night. Treating those as the same probability is the most common error in amateur HR-prop modelling, and the one with the biggest correctable downside.
Why The Math Always Wins Eventually
Launch angle data has democratised what used to be intuition. A scout watching a player in 1990 could tell you he had a “good swing” but could not tell you that he hit 8% of his batted balls in the 26 to 30 degree window. A bettor in 2026 can. That information advantage is real, and it is available for the price of an internet connection. The catch is that you actually have to look at it. The market is increasingly priced by people who do, and the punters who continue to bet on names and recent vibes are quietly transferring their bankrolls to the punters who bet on the underlying contact distribution. There is no path back – the maths is simply better than the gut, and the gap will only widen as the data gets richer.
What is the launch angle sweet spot for home runs?
The narrow band between roughly 26 and 30 degrees, where the physics of ball flight produce maximum distance for a given exit velocity. Statcast formally classifies any ball struck at 98 mph and 26 to 30 degrees as a barrel – the highest-probability home run profile. Hitters who consistently put contact in this window run higher home run rates than peers with similar exit velocity but flatter or higher swing paths.
How is sweet spot rate different from barrel rate?
Sweet spot rate is the percentage of batted balls between 8 and 32 degrees of launch angle, regardless of exit velocity. Barrel rate is more restrictive – it requires both high exit velocity and a tight launch angle window, with the sweet spot at 26 to 30 degrees. Sweet spot rate captures quality contact in general; barrel rate specifically captures the contact most likely to become home runs.
Published by the mlb Prop Bets Home Runs team.