Kauffman Stadium’s 2026 Renovation: New Walls, New Math for HR Props
 Available in US
I have been waiting for a renovation like this since I started taking park factors seriously, which was about ten years ago. Mid-season changes to outfield dimensions are vanishingly rare in MLB. Mid-pre-season ones are rarer still. And a renovation that pulls the fences in and drops the wall height in the same off-season – that is the closest thing the modern park-factor world ever sees to a clean experimental treatment. Kauffman Stadium just did it heading into 2026, and the implications for HR props are larger than most punters seem to realise. The market has been slow to fully reprice. There is real edge in the gap.
What Actually Changed in Kansas City
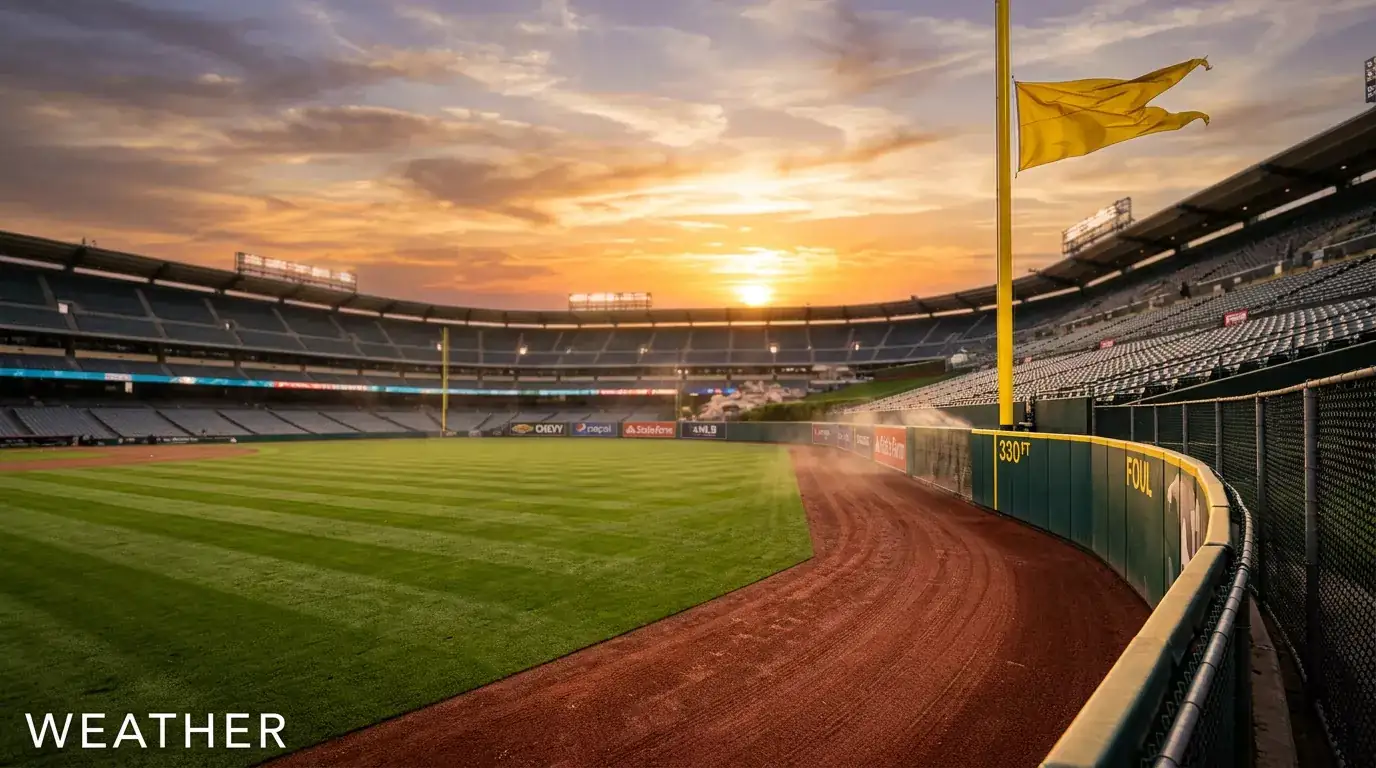
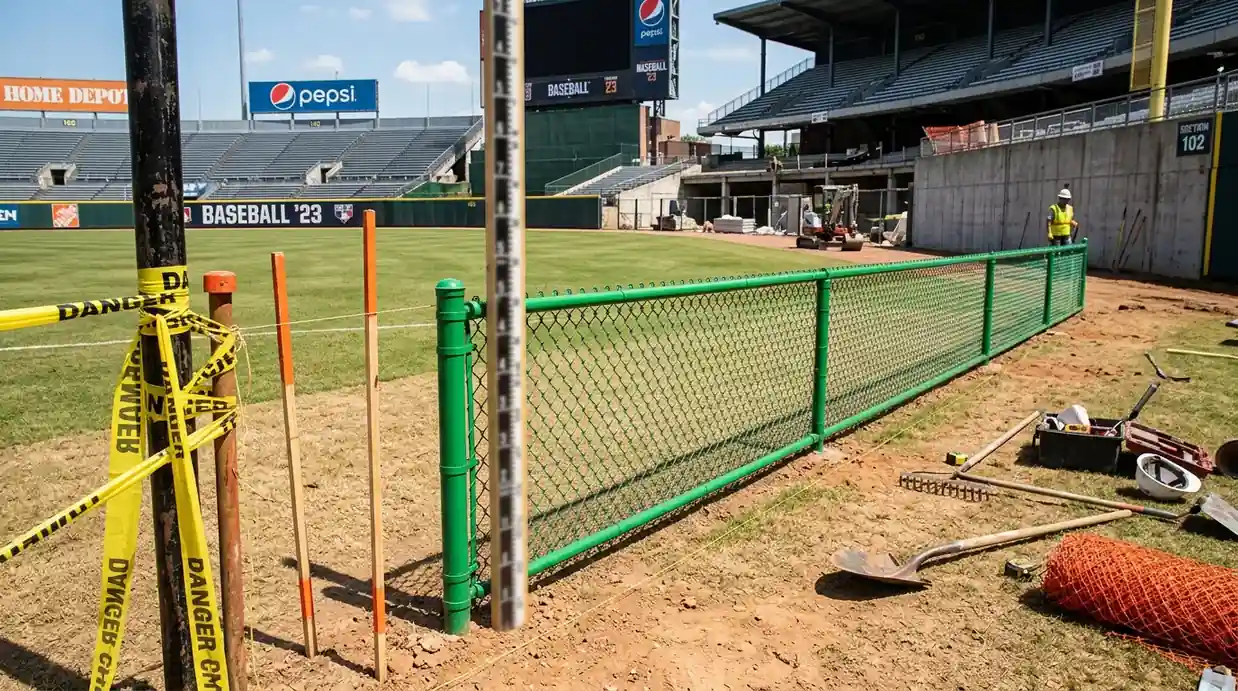
If you have not been tracking the Royals off-season, here is the practical summary. Heading into the 2026 season Kauffman Stadium had its outfield walls moved in by 8 to 10 feet across most of the perimeter, and the height of the fence dropped from 18.5 feet to 8.5 feet. That is a structural change of a kind I cannot remember seeing at any other MLB park in the Statcast era. Most renovations move one panel by a couple of feet. This one moved the entire outfield boundary in by close to 10 feet on average, and chopped two-thirds off the wall height in the bargain.
The dropped height matters as much as the pulled-in fence, possibly more. A ball that previously left the bat at 95 mph at a 22-degree launch angle and died on the warning track now sails over an 8.5-foot fence. A ball that hit high off the old 18.5-foot wall – a ball that probably went for a single or a double depending on the carom – now leaves the yard cleanly. Both of those scenarios are common. Both are now home runs in 2026 that would not have been in 2024.
How Big Is the Park-Factor Shift Likely to Be
I have no patience for vague “it should help hitters” claims. The question is how much it will help, and whether the market is pricing it in.
The dimensional change works out to roughly 10% to 15% additional fair territory on fly balls in the relevant landing zones. Combined with the reduced wall height, my best estimate is that Kauffman Stadium’s HR park factor moves from somewhere around 95 – slightly below league average – to somewhere in the 105 to 115 range, depending on how the air plays this summer. That is a swing of 10 to 20 park factor points, which is enormous. For comparison, the difference between a typical pitcher’s park and a typical hitter’s park in MLB is roughly 25 points across the board.
To put it in HR-prop terms: a Royals hitter with a baseline 17% true HR probability for a given matchup is now closer to 19% or 20% at home. That is the kind of edge that, if your operator’s pricing is based on stale park assumptions, generates +EV across an entire season’s worth of Royals home games.
The Comparison That Frames the Problem
To understand why the Kauffman renovation matters, look at what the most extreme pitcher’s parks have been suppressing. PNC Park in Pittsburgh in 2025 finished as the toughest park in MLB for home runs with an HR park factor of 66, with Busch Stadium next at 77. Old Kauffman sat in the broad middle of the chart, but it leaned suppressive – and the contour of its alleys, particularly to right-centre, had a long-running reputation for eating well-struck flies.
Pulling the fences in by 8 to 10 feet and dropping the wall changes the calculus on exactly those flies. The Royals’ lineup – particularly Bobby Witt Jr – produces a meaningful share of barrels that under old Kauffman would have come up just short of the warning track. Under new Kauffman, those same exit-velocity-and-angle combinations clear the wall. The shift is asymmetric: it favours pull-side power for both lefties and righties, because that is where most of the dimensional reduction concentrated.
How the Market Has Reacted So Far
Slowly. Frustratingly slowly, if you are looking for sharp pricing. In the first month of opening lines for the 2026 season, the to-hit-a-HR prices on Royals home games shifted maybe 10 to 15 cents on the most exposed bats. That is far too little, given the size of the structural change. Pricing models that did not get updated with the new dimensions in the off-season – and from what I can see in the lines, several of them did not – are still pricing Royals hitters as if Kauffman is the same park it was in 2024.
The way I have been working this in pre-season is fairly mechanical. I take the published HR-prop price on a Royals home game. I compare it to the same hitter’s HR-prop price on the road. If the home-road delta is essentially flat, that is a sign that the operator has not adjusted their park multiplier. That is the line I will take. If the delta has clearly opened up, the market has caught on, and I move along.
What I Bet Less Of, Now
One trap in the Kauffman story is to over-react and start firing on every Royals home game. That is wrong, and I have to actively talk myself out of it. The renovation makes Kauffman more hitter-friendly. It does not make Kauffman the new Coors. Royals hitters still face elite AL Central pitching, still play day games in the Kansas City summer when the air is heavy, still strike out at roughly the league average. The structural edge on a marginal HR prop is two to three percentage points of fair probability, not ten.
So my approach has been to add Kauffman home games to my standard HR-prop screen rather than to lead with them. The screen looks for the usual things – favourable matchups against high-HR-allowed pitchers, supportive launch-angle distributions, current barrel rates, lineup positioning. When a Royals home game also passes that screen, the renovation gives me a small additional edge. Without that screen, the renovation alone is not a play.
Here, more than anywhere, the comparison with pitchers’ parks is instructive. The opposite extreme – why parks like PNC and Busch reliably eat HR bets and what that means for under-the-line strategies – is just as important to understand if you are trying to read venue effects properly across the league.
The Two-Year Watch List
I will be watching three things across 2026 and 2027 to refine the Kauffman read. First, the actual measured HR park factor at end of season. The 100-to-115 range I expect is wide; pinning it down will let me size bets more precisely in 2027. Second, how the operators adjust mid-season. The smarter pricing engines will adapt within a month of seeing real data; the slower ones will lag for the entire summer, and that is where the persistent edge will be. Third, the wind patterns. Kauffman has historically had a slightly suppressive wind profile, but the tail of the distribution can swing widely on individual game days, and the new fence height makes the park more responsive to those gusts than it used to be.
Two years of data should be enough to put Kauffman where it actually belongs in the park-factor hierarchy. Until then, I am treating any Royals home HR-prop price that has not visibly shifted from its 2024 anchor as a small but real opportunity.
Reading Renovations the Right Way
The bigger lesson, beyond the Royals specifically, is that punters should pay close attention any time a club announces structural changes to their home park. The mainstream betting market is shockingly slow to incorporate them. The first month of a new park configuration is when pricing tends to be furthest from fair value, because the operators are running on prior-year priors and the data has not built up enough to override them. That window closes fast – by mid-season the smart money has usually corrected the lines – but it is real, and it is exploitable for punters who do their homework before opening day.
Kauffman 2026 is the cleanest example of this dynamic in years. If you are going to bet HR props on Royals home games this summer, do it with the renovation factored in, and do it before the market finishes adjusting.
How much will the Kauffman renovation change HR rates?
My best estimate is that Kauffman’s HR park factor moves from around 95 – slightly below league average – into the 105 to 115 range, depending on how the air plays. That is a swing of 10 to 20 park factor points, which translates to roughly two to three additional percentage points of fair HR probability per Royals home game for an average hitter.
When should I expect the market to fully reprice the renovation?
Based on past structural changes at other parks, the lag is typically four to eight weeks of regular-season data. Faster pricing engines adjust within a month of opening day; slower ones lag the entire first half. The cleanest window for finding mispriced lines is opening day through about mid-May.
Does the wall height drop matter as much as the pulled-in fences?
In some scenarios it matters more. Balls that previously hit high off the old 18.5-foot wall – a common outcome on well-struck flies in the gap – now clear the new 8.5-foot fence cleanly. The reduction in wall height affects a different distribution of batted balls than the dimensional pull-in, so the two effects compound rather than substitute.
Written by the editors at mlb Prop Bets Home Runs.