Wind Direction at MLB Ballparks: A Practical Reading Guide for Punters
 Available in US
I have a confession that will horrify any serious analyst. For the first six years I bet MLB props, I did not check wind. I checked everything else – temperature, park factor, pitch mix, lineup – but I treated wind as somebody else’s problem, the kind of thing the trader had already baked into the line. Then in 2019 I watched four straight tickets at Wrigley Field die on warning-track outs that should have been homers, only to discover that the wind had been blowing in at 18 mph all afternoon. The trader had baked it in. The trader had moved the price by twenty cents. I had paid full freight without looking. That afternoon was the last time I placed a Wrigley ticket without checking the flag at first base, and the lesson has saved me more money than any other single piece of due diligence I have ever added to my routine.
How Much a Tailwind Actually Adds
The maths on wind is more linear than you might expect, and the precise figure is one I keep written on a sticky note next to my monitor. A 5 mph increase in tailwind adds approximately 19 feet of distance to a fly ball. That is the headline number, and it scales roughly proportionally for stronger winds – a 10 mph wind adds about 38 feet, a 15 mph wind about 57. The relationship is not perfectly linear at extreme speeds, but for the practical range of 0 to 20 mph that you will encounter at most ballparks, treating it as linear is close enough.
That number matters because most home runs are decided by margins of 5 to 20 feet. A ball struck at 100 mph and 28 degrees might travel 395 feet at sea level in still air. Add 10 mph of tailwind and it is suddenly going 433 feet, well over any major league fence. Take 10 mph of headwind off the same ball and it is struggling to clear the warning track. That is the difference between a home run and a routine fly out, and it depends entirely on a single variable that you can check on a phone in 30 seconds.
Dr. Alan Nathan, the Illinois physicist whose work has shaped most of the modern understanding of baseball aerodynamics, put it directly: “The weather plays a role, it affects the flight of the baseball”. That sounds anodyne until you map it onto the prop board, where games priced for league-average distance get played in conditions that are anything but. The line on a hitter at +275 might be perfectly fair on a still afternoon. With 12 mph blowing out, the same line is closer to +200 in true probability, and with 12 mph blowing in, it is closer to +400.
The Stadiums Where Wind Drives the Whole Story
Not every ballpark is wind-sensitive. Some are bowls – closed stadiums with retractable roofs, or open stadiums whose seating walls block most surface flow. Others are what I think of as wind tunnels, where the field is exposed to the prevailing weather and the wind direction can swing the entire HR profile of the game.
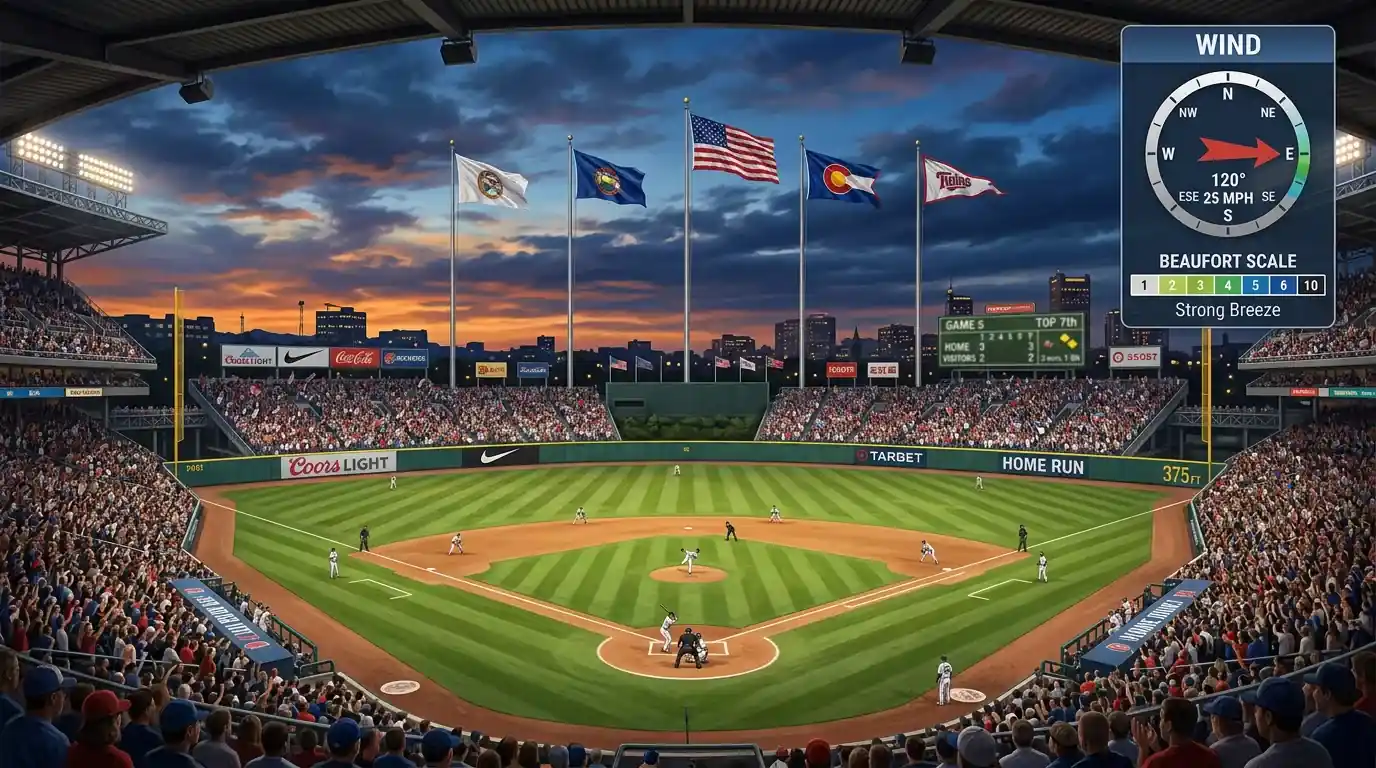
The classic wind-driven park is Wrigley Field. Sitting two blocks from Lake Michigan, it gets either an out-blowing wind that turns it into a launching pad or an in-blowing wind that turns it into a graveyard. The flag on the centre-field scoreboard is the signal every Cubs analyst checks before doing any other work. On 25 mph out days, Wrigley plays as the most home-run-friendly park in baseball, surpassing even Coors. On 25 mph in days, it might be the worst.
The other strongly wind-affected parks include Citi Field in New York, which catches Atlantic flow off Flushing Bay, Oracle Park in San Francisco with its famous swirling McCovey Cove wind, and Coors Field in Denver, where the altitude effect compounds with prairie wind. Coors Field sits at 5,280 feet (1,609 metres) above sea level, increasing ball flight distance by approximately 9% versus sea level, and on a 15 mph tailwind day the cumulative effect on a 380-foot fly ball is staggering – easily 50 feet of additional carry.
For UK punters, the practical hierarchy is to know which parks demand wind checks and which do not. Tropicana Field in Tampa Bay is fully indoors and wind is irrelevant. Same for Marlins Park, T-Mobile Park (when the roof is closed), Rogers Centre, and others. Open-air parks at coastal or lakeside locations almost always need a wind check. Inland open-air parks in low-elevation cities are more variable but worth a glance on any forecast that mentions sustained breeze.
Reading the Forecast Like a Trader
The forecast websites publish wind data in a few different ways, and not all of them are equally useful. The number that actually matters for HR props is the surface wind speed and direction at the time of first pitch, ideally from a station within a mile or two of the ballpark. Local airport readings are usually adequate. Regional summaries are not – a “northerly wind” across all of Greater Chicago might mean an in-blowing wind at Wrigley but does not specify magnitude or stability.
I use the National Weather Service’s site for any park I am betting, drilling down to the city-specific page and checking the hourly forecast for the game window. The relevant data points are wind speed, gust speed, and direction. Direction is given in compass degrees or as a cardinal abbreviation, and the orientation of the ballpark determines whether that direction is “out” or “in” for home run purposes.
This is the part that requires homework. Each MLB park has its own orientation, and a south wind at one stadium is an out-blow while at another it is a cross-wind. I built a personal cheat sheet that maps each park to the direction that constitutes a tailwind to centre field, and check the forecast against that. A 12 mph wind in a direction that is 40 degrees off the centre-field tailwind axis is meaningfully weaker for home runs than a 10 mph wind that is dead-on aligned. The component of the wind that matters is the part vector along the centre-field axis, and it falls off with the cosine of the angle. That sounds like maths-class abstraction until you realise it is the difference between a hot ticket and a marginal one.
Cross-Winds Are More Useful Than You Think
Most analysis of wind in baseball treats it as a one-dimensional problem – out is good, in is bad, anything else is noise. That misses an important second-order effect. Cross-winds change which sides of the field play larger, and that affects platoon-based HR props.
A wind blowing strongly from left field toward right field at Yankee Stadium is going to push fly balls away from the deep left-centre alley and toward the short right-field porch, helping left-handed pull hitters and hurting right-handed pull hitters. The same wind at Citi Field, which has a different orientation, helps and hurts different sides. Knowing the orientation of the park combined with the cross-wind direction lets you bias your HR-prop selection toward the hitters who happen to align with the wind on a given afternoon.
This is one of the cleanest spots for amateur edge. Most casual punters do not adjust for cross-winds at all. The lines tend to assume average park behaviour, and the cross-wind shift gets ignored. A bettor who consistently picks the hitter pull-side aligned with a 10 mph cross-wind is harvesting a few percentage points of probability on every relevant ticket. Over a season, that adds up.
The Compounding With Temperature
Wind does not exist in isolation. It interacts with temperature, and the combination is more powerful than either alone. The deeper writeup on how temperature affects home run probability at +1.96% per degree covers the warm-air physics in detail, but the short version is that warmer air is less dense, so the ball encounters less drag and travels further. Add a tailwind to a hot afternoon and you are stacking two distance multipliers.
The cumulative effect can be dramatic. A 28°C afternoon with a 12 mph tailwind compared to a 14°C afternoon with a 5 mph headwind represents a difference of approximately 60 feet of carry on a typical fly ball. Sixty feet is the gap between a comfortable home run and a routine warning-track out. The same hitter against the same pitcher will produce wildly different HR rates in those two environments, and the trader’s line typically captures only a fraction of the swing.
For a UK punter watching games that start in the early hours by local time, the practical workflow is to check the forecast for the game window – usually evening or night in the US, which is the early morning UK – and bias bets toward the warm-tailwind games. The cold-headwind games are usually best avoided entirely, regardless of how attractive the hitter and pitcher matchup looks.
What Wind Cannot Tell You, and What It Always Will
The honest limit of wind analysis is that forecasts are forecasts. The actual wind on game night is sometimes different from the prediction, and games at parks with notoriously unstable wind (Oracle Park is the classic example) can shift profile in the middle of the game. You are betting on a probabilistic distribution of conditions, not a guarantee.
That said, the average forecast skill on wind is good enough that consistent attention pays off. You will be wrong on individual games, but across a season the directional signal is reliable. The trader builds a wind adjustment into the line based on the same forecasts you can read, but the trader is doing it for fifteen games while you might be doing it for the three you actually want to bet. That focused attention is the amateur’s main remaining edge in a market that has otherwise been heavily professionalised.
I will close with the discipline that matters most. If the forecast is a stiff in-blowing wind at any park I would otherwise consider, I do not play HR props on that game. The variance is brutal even when conditions are favourable; with the wind explicitly working against the hitter, the expected value collapses to negative on virtually every reasonable price. Skipping bad spots is not exciting, but it is the closest thing to a free win the prop board offers, and the punters who skip patiently are the ones still standing at the end of a long season.
Which MLB ballparks are most affected by wind direction?
Wrigley Field is the classic example, with strong lake-driven winds that can swing it from launching pad to graveyard depending on direction. Citi Field, Oracle Park in San Francisco, and Coors Field are also strongly wind-affected. Closed-roof or partially enclosed parks like Tropicana Field, Marlins Park, and Rogers Centre when shut are wind-irrelevant. Coastal and lakeside open-air parks always demand a wind check before placing HR-prop bets.
How much does wind realistically add to fly-ball distance?
Approximately 19 feet for every 5 mph of tailwind, scaling roughly linearly within the 0 to 20 mph range that covers most game conditions. A 10 mph tailwind adds about 38 feet, which is enough to turn a typical warning-track fly into a clear home run. Cross-winds also matter because they redirect fly balls toward different parts of the outfield, which interacts with park asymmetry and platoon profiles.
Written by the editors at mlb Prop Bets Home Runs.