Why Dodger Stadium Tops the 2026 HR Park Factor Charts at 129
 Available in US
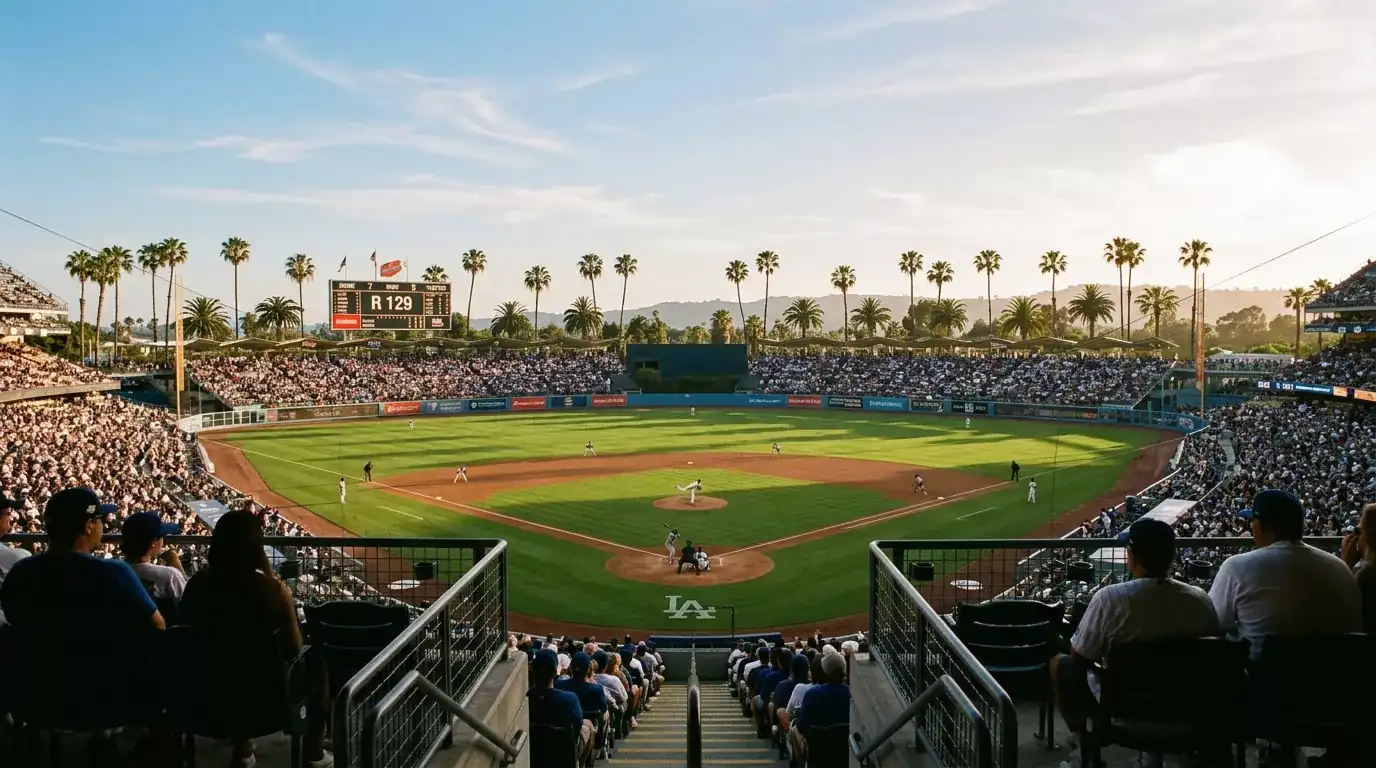
Dodger Stadium became my favourite venue for HR-prop bets sometime around 2021, and not because the Dodgers had Mookie Betts in his prime. It became my favourite because I started running a simple track of my prop performance by venue, and Dodger Stadium consistently outperformed every other park I bet at, with one specific exception. Coors. The interesting question was why. Coors has the altitude story, the dry air, the desert climate. Dodger Stadium is a sea-level park with mild Pacific air. On paper they should not even be in the same conversation. And yet there it sits, year after year, at the top of the leaguewide HR park factor charts. After several seasons of digging into why, I now think Dodger is the most underestimated home run environment in baseball, and the reasons have less to do with the obvious physics than with a stack of subtler factors that the typical bettor never thinks about.
The Number That Should Be Bigger News
Here is the headline. Dodger Stadium leads MLB in 2024 to 2026 with a home run park factor of 129 – meaning it produces 29% more home runs than the league average. That figure puts it above Great American Ball Park in Cincinnati (122), above Camden Yards, above Citizens Bank Park, and even above Coors Field, which still tops the absolute distance metrics but does not always top the HR factor charts because home run rates depend on more than just distance.
The 29% boost is not a small effect. It means that the same hitter, with the same opponent, in the same weather, will produce 29% more home runs across a long enough sample at Dodger than he would at a league-average park. For HR-prop bettors, that translates to roughly six percentage points of additional probability on the standard market, and a meaningfully steeper bump on the alternate 2-plus lines.
The reason this surprises people is that Dodger Stadium does not look like a launching pad. The dimensions are not radically short. The fences are not absurdly low. The atmosphere is mild, often a touch foggy. There is no obvious physical anomaly. And yet the data is unambiguous: more home runs come out of Dodger than out of any other ballpark in the modern game.
The Stack of Hidden Variables
The reason Dodger plays as it does is that several smaller factors compound. The first is the marine layer, the cool moist air that flows in from the Pacific most evenings. Counter-intuitively, that air is slightly less dense than dry inland air at the same temperature, because water vapour is lighter than the nitrogen and oxygen it displaces. The marine effect is small – maybe 1 to 2% additional carry on fly balls – but it is consistent, and it operates during evening games specifically, which is when most Dodger home games are played.
The second factor is the wind. Dodger Stadium sits in a natural bowl in the hills above downtown Los Angeles, and the prevailing evening winds blow gently from the west, which is roughly aligned with the centre-field axis. That mild, persistent tailwind on the bulk of fly balls adds a couple of feet of carry – small per ball, meaningful in aggregate. Again, deeper analysis on why other parks like PNC and Busch run the opposite profile and consistently suppress home runs highlights how localized environmental conditions can swing park factor in either direction.
The third factor is the foul-territory geometry. Dodger has relatively spacious foul territory near the dugouts, which converts more fly-foul balls into outs that would have died in the seats at other parks. That sounds like it should hurt hitters, and it does – slightly – for batting average. But it does not hurt home runs, because home runs are not foul balls. The foul-territory effect helps the home-run-to-batted-ball ratio specifically, because outs come from somewhere other than the home run zone.
The fourth and least-discussed factor is the playing surface. Dodger Stadium has been resurfaced multiple times since its 1962 opening, and the current configuration produces slightly higher infield bounces, which in turn produces a marginally higher rate of fly balls per batted ball. More fly balls in absolute terms means more home runs in absolute terms, even at the same per-fly-ball home run rate.
The Lineup Slot Effect at Dodger
One of the consistent patterns I have noticed is that Dodger plays bigger for left-handed pull hitters than the headline 129 suggests. The right-field fence is not unusually short, but the marine layer flows from the west, which is roughly the direction left-handed pull hitters drive the ball. That alignment is subtle but real, and it explains why the Dodgers’ own left-handed bats – Freddie Freeman in his prime, Cody Bellinger when he was healthy, Max Muncy when he was hot – have produced disproportionately at home.
For HR-prop bettors, the implication is that Dodger games are slightly better for backing left-handed pull hitters than the park factor alone suggests. A right-handed slugger gets the standard 29% boost. A left-handed pull hitter gets that plus an additional couple of percentage points from the wind and atmospheric alignment. On the alternate 2-plus lines, where small probability shifts compound into big price differences, that extra edge is meaningful.
The opposite is true for right-handed opposite-field hitters. Hitting the ball to right field at Dodger as a right-hander is fighting the marine flow, and the home run rate on that batted-ball profile drops below what the headline park factor would suggest. The trader does not always price this micro-platoon effect correctly, and bettors who pay attention can pick spots accordingly.
The Weather Pattern That Dominates the Schedule
Dodger Stadium has the most consistent weather of any major league park, which is one of the reasons the park factor has been so stable across seasons. Los Angeles summers are warm but not extreme, evenings are reliably mild, and rainouts are rare. That stability means the home run effect is reliable – you do not get the wild swings between sweltering July afternoons and chilly April nights that you see at Wrigley or Boston.
The flip side of that consistency is that there are fewer outlier afternoons that produce disproportionate edges. Coors gets the occasional mid-summer 35°C blast where the home run rate explodes; Dodger gets a steadier 26 to 30°C daytime range and 22 to 26°C evening range. The HR-prop value at Dodger is therefore more about volume than about peak conditions – you can play more games confidently because the environment is predictable, but you rarely find the kind of single-game spike that produces an obvious hammer.
For UK punters watching games on the West Coast, the timing is also worth noting. Dodger evening starts are typically 7:10 PM Pacific, which is 3:10 AM in the UK. That is a genuinely difficult window for most bettors to monitor live, and it is one of the reasons West Coast lines tend to settle slightly less efficiently than East Coast lines. The bookmakers price them in advance, the public action is thinner, and the smaller drift opportunities I mentioned earlier are slightly more available.
The Pitching Side That Most Punters Get Wrong
The Dodgers themselves have been a pitching-first organisation for a decade, which complicates the home/away splits. Their starters have been engineered specifically to keep the ball on the ground at home, where the park factor punishes fly-ball pitchers. That means visiting Dodger pitchers (the ones the opposing team brings) often have profiles that do not match the home park, and their HR rates allowed at Dodger are inflated relative to what they would be elsewhere.
For HR-prop bettors, the actionable read is to focus on visiting pitchers’ fly-ball rates. A fly-ball-heavy starter visiting Dodger Stadium is going to leak home runs at a rate that exceeds his season average. A ground-ball pitcher’s exposure is more contained. The line on the opposing slugger should reflect this, and sometimes it does, but the fly-ball-pitcher angle is consistently underweighted on smaller books and on second-tier matchups.
The home Dodger pitchers, conversely, are usually solid plays for the under side of HR markets. They are pitching to their park’s weakness and are typically engineered for it. A casual punter who reflexively bets on home run props at Dodger because “it is a hitter’s park” is going to lose against the Dodgers’ own staff, which has been built specifically to defy the park factor.
The Comparative Picture Across the League
To put Dodger Stadium’s 129 in fuller context, the second-place park is Great American Ball Park (Cincinnati) at 122. The gap between first and second is meaningful – seven percentage points of additional HR rate is the difference between “hitter-friendly” and “elite hitter-friendly”. Below that, the cluster of mid-range hitter parks (Camden, Citizens Bank, Coors itself when temperature is moderate) sits in the 110 to 120 range, and the league average sits at 100 by definition.
The other end of the chart is just as informative. PNC Park (Pittsburgh) was the most difficult park in MLB for home runs in 2025 with a HR park factor of 66, with Busch Stadium next at 77. The gap from Dodger Stadium’s 129 to PNC’s 66 is a 63-point swing, which translates to a roughly 95% difference in home run rate between the two venues. The same hitter, the same pitcher, the same weather – at Dodger he is essentially twice as likely to homer as at PNC. That is a colossal swing for a single environmental variable, and it tells you why park factor sits at the centre of any serious HR-prop modelling.
The Practical Workflow for Dodger Slates
My personal approach to Dodger Stadium games is structured around volume. I bet more games at Dodger than at any other park, but I size each individual ticket at standard rather than larger stakes. The strategy is to harvest the consistent positive edge across many bets rather than to size up on any single one. The variance is too high on individual HR-prop tickets to do otherwise, and the Dodger environment is reliable enough that the long-run statistics flow from frequency, not from concentration.
The matchups I prefer are visiting fly-ball pitchers facing the Dodgers’ left-handed lineup, or Dodger lefties at home against right-handed starters with elevated HR/9 rates. Both of those profiles compound the park factor with hitter-side advantages and produce the cleanest expected-value calculations. The matchups I avoid are Dodger ground-ball starters at home, where the under side of HR markets is the structural play, and games scheduled during the rare cool spring afternoons in late March and early April, where the temperature suppression partially neutralises the park advantage.
Across an MLB season, Dodger Stadium is the single park where I expect to be a net winner on HR props. Every other park is a wash to slight loss to slight gain. Dodger is the structural edge, year after year, and the punters who recognise that and bet accordingly tend to have the smoothest equity curves through the long summer grind.
What makes Dodger Stadium the highest home run park factor in 2026?
The park does not have any single dramatic feature like Coors’s altitude, but it stacks several smaller factors – the Pacific marine layer adds slight atmospheric carry, the prevailing evening winds align with centre field, the foul territory geometry produces a higher home-run-per-batted-ball ratio, and the playing surface yields a marginally elevated fly-ball rate. Together those compound into the 29% above-league-average home run rate that defines the park.
Which side of the plate plays bigger at Dodger Stadium?
Left-handed pull hitters get a slight additional advantage beyond the headline park factor, because the marine flow from the west aligns roughly with the direction those hitters drive the ball. Right-handed opposite-field hitters get less benefit and may even underperform the headline figure. The micro-platoon effect is real but not always reflected in the line, which is one of the cleaner edges available at this venue.
Created by the ”mlb Prop Bets Home Runs” editorial team.