Pitcher HR/9 and Barrel Rate Allowed: Reading the Other Side of the Matchup
 Available in US
Table of Contents
- HR/9 Is the Number Everyone Quotes and Almost No One Uses Properly
- Barrel Rate Allowed Is the Stat That Actually Predicts What Comes Next
- Pitch Mix and the Profile That Actually Matters
- Ground Ball Rate Is the Quiet Bet-Killer
- The Pitcher Who Is Actively Losing It
- Building the Pitcher Model Into Your Probability Estimate
- What This Approach Has Cost Me, and Where It Has Paid
I used to spend almost all of my matchup analysis on the hitter and treat the pitcher as background noise. Then in 2017 I lost twelve consecutive HR prop tickets in a fortnight, mostly on heavy favourites at hitter-friendly parks, and when I went back through the games I noticed that ten of the twelve had been against the same handful of starters with absurd ground-ball rates. The hitters were good. The parks were favourable. But every batted ball was finding the dirt instead of the seats, and my probability model had no field for “this pitcher does not allow fly balls”. That was the season I learnt that the pitcher’s contribution to a home run prop is not a rounding error. It is half the equation, and on the right night it is the dominant half.
HR/9 Is the Number Everyone Quotes and Almost No One Uses Properly
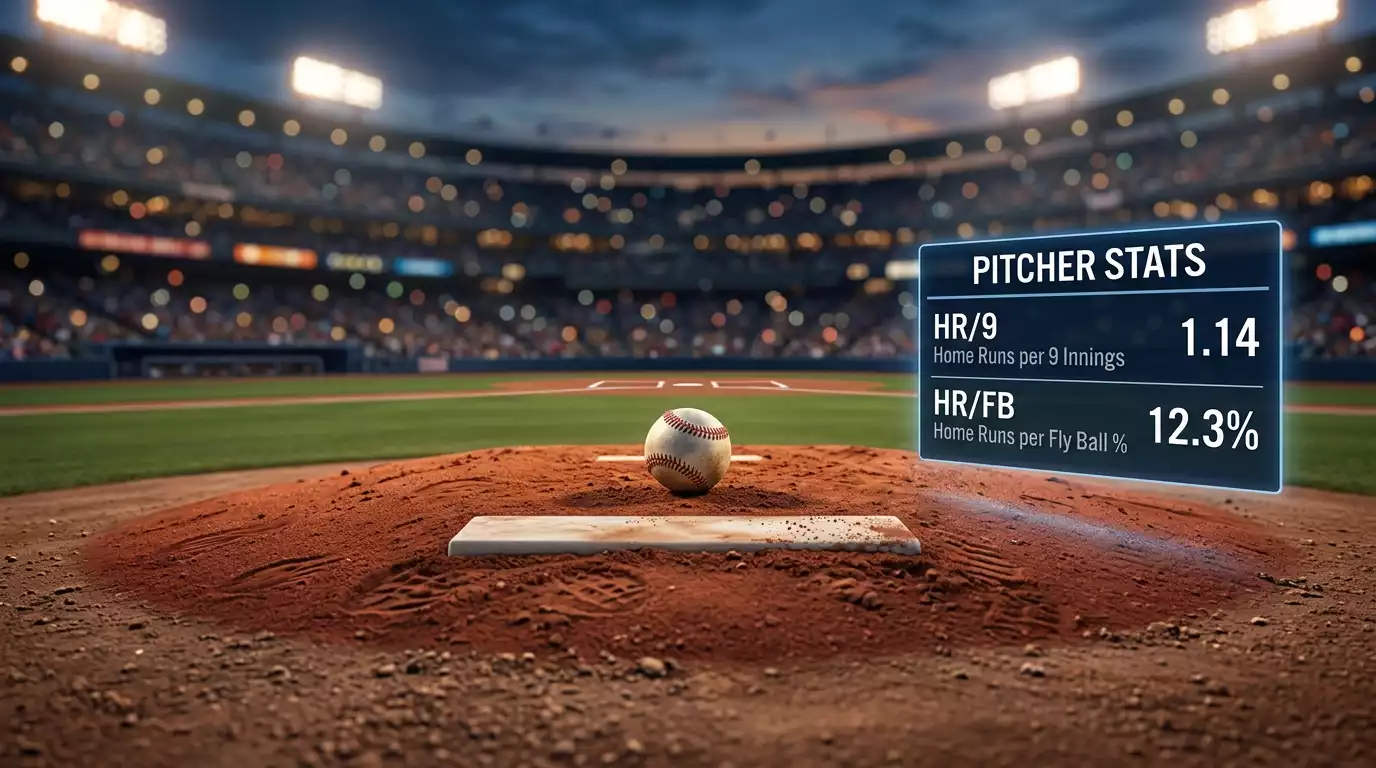
HR/9, or home runs allowed per nine innings, is the workhorse pitcher stat. You see it on every fantasy site, every betting article, every broadcaster graphic. League average sits around 1.20 in recent seasons. A starter at 1.50 or higher is a HR-prop bettor’s friend; one at 0.90 or lower is the kind of guy who quietly kills your tickets at smaller parks.
The trouble is that HR/9 is a season-long aggregate, and using it raw is like using a player’s batting average to predict their next at-bat. The number tells you what the pitcher has done, not what he is currently doing. A starter with 1.50 HR/9 over the season might be running 0.80 over his last six starts because he has been working a different pitch mix, healthier, or facing softer lineups. The opposite is also common – a guy at 0.90 on the season who is suddenly leaking home runs because he has lost a tick of velocity or his slider has flattened out.
What I do instead is look at HR/9 over the last six to eight starts, then cross-reference it with his career number and his platoon-specific number. If a right-handed starter has a career HR/9 of 1.10 and a recent run of 1.80, but his split against left-handed hitters is steady at 1.30 and the only opposing slugger I am betting on is a lefty, the recent run might be a small-sample fluke driven by a couple of cookies served to right-handers. Conversely, if his lefty split is the part that has spiked, the bet is live.
Barrel Rate Allowed Is the Stat That Actually Predicts What Comes Next
HR/9 is descriptive. Barrel rate allowed is predictive, and the difference between those two words is worth real money. A barrel in the Statcast system is defined as a batted ball with minimum exit velocity of 98 mph; at exit velocity 98 mph, balls struck at launch angles between 26 and 30 degrees are always classified as barrels. Barrels turn into home runs at a much higher rate than any other batted-ball type. Roughly 60% of barrels leave the yard. Almost everything else stays in.
So when I evaluate a pitcher, I want to know how many barrels he allows per nine innings, not just how many home runs. The reason is that barrels happen pre-physics – they capture the contact quality before park, weather, and outfield positioning interfere. A pitcher with low HR/9 but high barrel rate allowed is at risk. He has been getting lucky. The barrels are happening, but they have been finding warning tracks instead of seats. That luck is mean-reverting, and a few hot nights at hitter-friendly parks will close the gap.
The opposite profile is also valuable. A pitcher with high HR/9 but low barrel rate allowed is probably getting unlucky. The home runs he has allowed have been just-enough fly balls that found the wind, not crushing barrels that were always going to leave. That guy will likely tighten up, especially in pitchers’ parks. Betting against his upcoming opposing slugger is less appealing than the surface HR/9 suggests.
For a deeper look at the launch angle physics that produce barrels in the first place, the explainer on why 26 to 30 degrees is the launch angle sweet spot walks through the geometry that makes the barrel definition so predictive. The two stats reinforce each other.
Pitch Mix and the Profile That Actually Matters
One step deeper. Two pitchers can have identical HR/9 and barrel rate allowed and still pose completely different threats to a hitter. The reason is pitch mix. A starter who lives on a 96 mph fastball at the top of the zone is vulnerable to a pull-side power hitter who can catch up. A starter who lives on a slow curveball and a sinker is much harder for the same pull-hitter to elevate, even if the seasonal numbers look similar.
For HR-prop bettors, the pitches that matter most are four-seam fastballs in the upper third of the zone and hanging breaking balls. Both leak home runs at higher rates than the pitcher’s overall numbers suggest. A starter who throws 60% four-seam fastballs and gets behind in counts is an elevated HR risk regardless of his HR/9. The hitters get to predict, and they get to swing through the zone where the ball is most punishable.
I track pitch mix from a few free public sites and compare each starter to a baseline of his peers. Anything more than 5% above league average for high-velocity four-seamers, combined with above-average barrel rate allowed, is a flag for the hitters facing him. Anything heavily weighted toward sinker-slider mix at the knees is the opposite, especially against hitters who pull the ball into the air.
Ground Ball Rate Is the Quiet Bet-Killer
Beyond barrels and pitch mix, the single most underrated stat for HR prop bettors is the pitcher’s ground ball rate. League average sits around 42% in recent seasons. A starter at 50% or higher is what I call a HR-prop landmine. His batted balls are spending their time in the dirt, not in the air, and even an elite power hitter cannot homer on a ball that bounces three times before reaching the third baseman.
A starter with a 55% ground ball rate is essentially capping the upside of every hitter in the opposing lineup. The fly balls he does allow are still vulnerable, but the pure volume of home-run-eligible contact is reduced by about a third compared to a fly-ball pitcher. If you are betting a slugger at +275 against a 50%+ GB pitcher, you are paying full price for half the contact opportunities. That is a slow, structural drain on your bankroll.
The two pitchers most punters mishandle are sinker specialists and the rare extreme contact managers. Both produce ugly box scores for hitters and quietly destroy HR-prop tickets. I built a personal blacklist of starters with seasonal GB rates above 55%, and I refuse to take HR props against them at any price short of +600 or longer. The expected value just is not there.
The Pitcher Who Is Actively Losing It
One last category worth flagging: the starter who is mid-collapse. Every season produces a handful of pitchers who, for reasons of injury, mechanical drift, or pure regression, fall off a cliff. The HR/9 numbers move first, the velocity numbers move second, and the public typically catches up two or three starts later than the line should reflect.
I monitor velocity reports closely. A starter who has lost two miles per hour off his fastball over four starts is a different pitcher from the one whose name is on the line sheet, and the books are slow to fully repricing on a four-start sample. Hitters facing him are quietly more likely to go deep, and the prices have not yet adjusted. That is one of the cleaner edges on the prop board, and it has nothing to do with the hitter at all.
The flip side is the starter who is unexpectedly improving. Velocity is up, breaking ball is sharper, the home runs he was allowing have stopped. The market eventually catches up, but in the meantime hitters facing him keep getting priced as though he were the same starter who allowed 1.80 HR/9 last August. That is a fade – the prop is overpriced, and the hitter is unlikely to homer at the implied probability. Both signals are findable with a fortnight of public data review.
Building the Pitcher Model Into Your Probability Estimate
For an HR-prop bettor, the pitcher matters in three layers. The headline layer is HR/9, which gives you a baseline expectation. The middle layer is barrel rate allowed, ground ball rate, and pitch mix, which tells you whether the headline is reliable. The deep layer is recent form – last six starts, velocity trend, command profile – which tells you which version of the pitcher is showing up tonight.
My adjustment to the hitter’s baseline HR rate is multiplicative. A pitcher one standard deviation worse than league average bumps the hitter’s rate by roughly 10%. A pitcher one deviation better cuts it by 8%. Extreme outliers – the 1.80 HR/9 starter or the 0.60 HR/9 starter – get bigger adjustments, but I cap them at 25% in either direction to avoid overfitting on small samples. The cap is a discipline thing. I have learnt the hard way that betting hitters facing soft pitchers at full conviction is a great way to get burnt by ground-ball luck or a one-night dominant performance from a pitcher who suddenly remembers how to pitch.
The whole exercise is mechanical and unglamorous. Each pitcher gets a profile in my spreadsheet, the profile updates every week, and the home run prop bets I take on a given slate are filtered through the pitcher layer before any hitter-side bias is applied. The discipline of letting the pitcher data speak first, before the slugger’s name does, is the single most profitable habit I have built across eleven years of prop betting.
What This Approach Has Cost Me, and Where It Has Paid
The cost of taking the pitcher seriously is that you bet less. A lot of slates that look juicy on the hitter side disappear once you check the opposing starter and find a 53% GB rate or a hidden velocity surge. That is fine. The job of a long-term-positive bettor is to skip the bad spots, not to play the marquee names every night. The payoff is that the bets you do place have a structural reason behind them, and the structural reasons compound over a season into a steady positive track record. The hitter side gets all the glamour, but the pitcher side is where the discipline lives, and discipline is what survives the variance.
Should I trust pitcher HR/9 or barrel rate allowed more for predicting home run props?
Use both, but lean on barrel rate allowed for predictive purposes. HR/9 is descriptive – it tells you what has happened. Barrel rate allowed captures the underlying contact quality and predicts what is likely to happen next. A pitcher with low HR/9 but high barrel rate allowed is at risk of regression, while a pitcher with high HR/9 but low barrel rate allowed has been unlucky and is likely to tighten up.
How much does ground ball rate matter when picking home run props?
A great deal. A starter with a 55% or higher ground ball rate caps the upside of every hitter in the opposing lineup, because batted balls in the dirt cannot become home runs. I avoid HR props against pitchers with seasonal GB rates above 55% unless the price is very long. The volume of HR-eligible contact simply is not there, regardless of how strong the hitter’s profile looks.
Prepared by the mlb Prop Bets Home Runs editorial staff.