Exit Velocity Thresholds: From 95 mph Hard-Hit to 122.9 mph Records
 Available in US
Table of Contents
- Why Exit Velocity Is the Most Honest Stat Baseball Has
- The Threshold Hierarchy That Actually Predicts Home Runs
- Average Exit Velocity Versus Maximum Exit Velocity
- The Pitcher’s Side of Exit Velocity Allowed
- The Streaks That Are Real and the Streaks That Aren’t
- The 30/30 Pattern That Exit Velocity Helped Reveal
- The Threshold That Matters Most for Your Bankroll
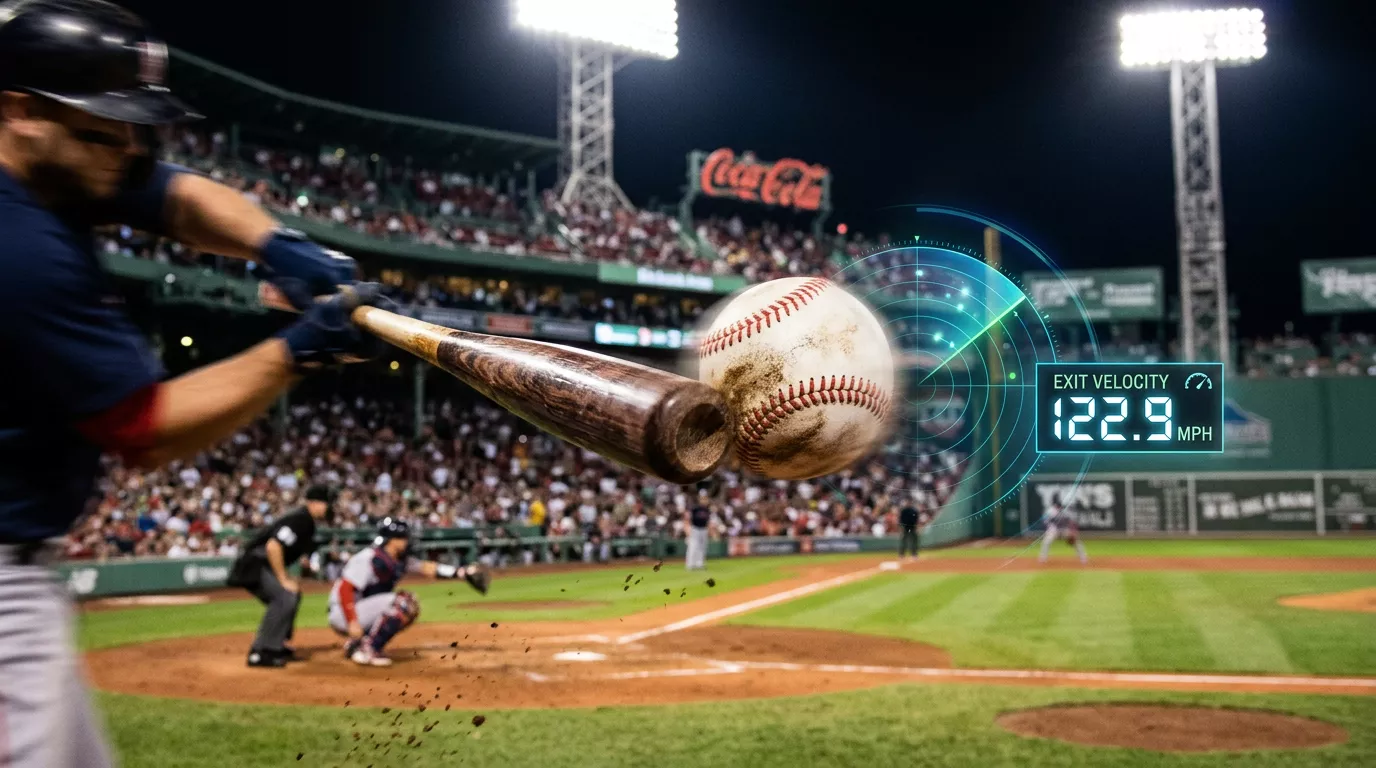
I remember the first time I saw a Statcast exit velocity number scroll across a broadcast feed and felt something genuinely click. It was an Aaron Judge double down the line in 2017, and the graphic flashed 116 mph. Up until that moment, exit velocity had been an abstract analytical concept – a stat I had read about in fantasy articles. Seeing the number tied to a specific contact event, then watching the ball obliterate the wall, made it real in a way nothing else had. That single graphic taught me more about home run prediction than two seasons of betting on highlight reels had. Velocity tells you the truth that swings and box scores cannot. The trick is knowing which thresholds matter and which ones are noise.
Why Exit Velocity Is the Most Honest Stat Baseball Has
Exit velocity is the speed of the ball coming off the bat, measured in miles per hour. It captures the raw force of contact between the bat and the ball at the moment of impact, and it is one of the few baseball stats that is essentially impossible to fake. A hitter cannot accidentally crush a ball at 110 mph. He cannot sneak a 115 mph blast past anyone. The radar sees what the radar sees, and the radar has been seeing it consistently since 2015.
The infrastructure that captures all this is worth understanding briefly. Hawkeye cameras (twelve installed in each ballpark) replaced the older TrackMan system in 2020 and now track every pitch and every batted ball for the Statcast system. The system is precise, the data is published, and any bettor with an internet connection has access to the same numbers the front offices use. That democratisation is one of the great gifts to the prop market over the last decade – it has shifted the analytical balance from professionals to anyone willing to read.
The reason exit velocity matters more than batting average for HR prop bettors is simple: home runs are a contact-quality outcome, not a contact-quantity outcome. A hitter who puts the ball in play 70% of the time but averages 88 mph on contact will produce singles and doubles. A hitter who puts the ball in play 60% of the time but averages 96 mph will produce home runs. The volume difference matters less than the velocity difference, because home runs only happen at the top of the velocity distribution.
The Threshold Hierarchy That Actually Predicts Home Runs
Exit velocity has a few key thresholds that bettors should commit to memory. The first is 95 mph – the official MLB definition of “hard-hit”. A ball struck at 95 mph or higher is filed as hard-hit contact, and a hitter’s hard-hit rate is one of the cleanest year-over-year predictive signals in the sport. League average hard-hit rate sits around 38%. Anything above 45% is excellent. Above 50% is rare and indicates an elite power profile.
The second threshold is 98 mph, which is where the formal definition of a barrel begins. A barrel requires a minimum exit velocity of 98 mph; at exactly 98 mph, balls struck at launch angles between 26 and 30 degrees are always classified as barrels. As velocity rises above 98 mph, the launch angle window for “barrel” status widens, because the harder you hit a ball the more launch angles produce home-run-quality flight. By the time you reach 110 mph, virtually any reasonable launch angle becomes a home run threat.
The third threshold is the upper extreme. In 2025 Oneil Cruz hit a home run on 25 May with an exit velocity of 122.9 mph – the hardest-hit home run in the Statcast era since tracking began in 2015. That is essentially the physical ceiling of what an MLB hitter can produce with a wood bat against a major league fastball. Cruz is a one-of-one outlier, but the broader category – hitters who occasionally produce 115+ mph contact – is small and worth tracking, because those hitters convert near-misses into home runs that other hitters cannot.
Average Exit Velocity Versus Maximum Exit Velocity
One of the trickiest decisions for a bettor is which exit velocity number to focus on. The two main flavours are average exit velocity (across all batted balls) and 90th percentile exit velocity (the speed at which the hitter strikes his hardest 10% of contact). Both are useful, but they answer different questions.
Average exit velocity tells you how hard the hitter typically connects. A hitter at 92 mph average is well above league norm and is a credible HR threat. A hitter at 87 mph is below average and rarely produces enough force to clear fences without help from wind or altitude. The average is a stable, slow-moving stat that captures what the hitter does most of the time.
The 90th percentile is where home runs actually live. A hitter at 109 mph 90th percentile produces high-end contact often enough to translate into homers. A hitter at 102 mph 90th percentile rarely reaches the velocity required for a clean barrel and is dependent on park, weather, and luck for home runs. Shohei Ohtani in 2025 ran a 58.4% hard-hit rate, the second-highest in MLB – that figure reflects how often his contact crosses the 95 mph line, and it is a leading indicator of his power output more than his average exit velocity is.
For HR-prop bettors, I track 90th percentile exit velocity as the headline. The hitters with elite 90th percentile numbers are the ones who can punish marginal pitches. A hitter who only reaches 100 mph at his best is not going to homer on a hanging slider that catches enough of the plate. A hitter at 110+ mph at his 90th percentile turns the same hanging slider into a 415-foot blast.
The Pitcher’s Side of Exit Velocity Allowed
Exit velocity is a two-way stat. Pitchers can be measured by the average exit velocity they allow on contact, and the spread between elite and poor pitchers is meaningful. A starter at 86 mph allowed is suppressing contact quality. A starter at 92 mph allowed is giving up rockets, and his HR rate is going to follow.
What I look for as a bettor is the gap between a pitcher’s expected and actual home run rates. A starter who allows 92 mph average exit velocity but has only allowed eight home runs in fifteen starts is sitting on regression. The contact has been hard, the home runs have been suppressed by random outfield positioning or warning-track luck, and the next stretch of starts is likely to see a HR-rate spike. Conversely, a starter at 87 mph allowed who has given up twelve homers in the same window has been unlucky, and the homers are likely to slow.
This kind of two-way analysis is the reason I bet against my hitter even when his profile looks great, if the opposing starter is a contact-quality outlier. A 95 mph hard-hit hitter against a starter who allows 86 mph average exit velocity is going to produce ground balls and weak fly balls, and the HR prop is essentially priced for an event that is unlikely to occur. The deeper writeup on pitcher HR rate and barrel rate allowed walks through this opposite-side analysis in more detail.
The Streaks That Are Real and the Streaks That Aren’t
One of the most useful things exit velocity data does is separate genuine hot streaks from lucky ones. A hitter who has hit four home runs in a week looks streaky on the surface. If his exit velocity over those games is 96 mph average and 113 mph 90th percentile, the streak is rooted in genuine contact quality and probably has more legs. If his exit velocity is 89 mph and 102 mph 90th percentile, he has been getting fortunate – fly balls finding the right wind, marginal contact reaching the wall – and the streak is likely to end soon.
The opposite scenario is equally valuable. A hitter who has gone homerless for two weeks but is sitting at 94 mph average and 110 mph 90th percentile is producing the same quality of contact as always. The home runs are coming. The market often discounts him during the cold spell, and that discount is the bettor’s friend if you trust the underlying numbers.
This is what professional bettors mean when they talk about “regression”. They are not invoking some mystical statistical force. They are simply observing that contact quality is a more stable signal than home run output over short windows, and that home run rates tend to drift back toward what the contact quality predicts. The bettors who internalise this avoid the two cardinal sins of recreational HR-prop betting: chasing hot streaks built on flimsy contact, and fading cold streaks built on solid underlying numbers.
The 30/30 Pattern That Exit Velocity Helped Reveal
Exit velocity data has also reshaped how analysts think about player versatility. Seven MLB players in 2025 hit at least 30 home runs while stealing at least 30 bases – a record number of 30/30 hitters in a single season. That cluster is partially a function of league trends in athleticism, but it is also a function of exit velocity tracking giving teams confidence that smaller, faster players could still produce barrel-quality contact when they swung up.
For HR-prop bettors, the implication is that the pool of credible home run threats has widened. A decade ago, you bet HR props on 215-pound corner outfielders. Today, you bet them on 175-pound centre fielders who run 4.0-second home-to-firsts and produce 108 mph 90th percentile exit velocities. The athletic profile has decoupled from the slugging profile. Looking at body type and assuming you know who can homer is no longer reliable. The data tells you who actually does, and the data does not care what jersey size the hitter wears.
The Threshold That Matters Most for Your Bankroll
If I had to pick one exit velocity threshold for a bettor to memorise and use, it would be the 90th percentile reading. That single number, combined with the launch angle distribution we covered separately, tells you almost everything you need to know about a hitter’s home run profile. Average exit velocity is too smoothed out, hard-hit rate is too coarse, and maximum exit velocity is too sample-dependent. The 90th percentile sits in the goldilocks zone of stability and predictiveness, and the hitters who lead the league in it are the ones whose HR prop tickets are reliably worth playing across full seasons. The market sometimes prices them efficiently, but on enough nights – at the right park, against the right pitcher, in the right weather – the gap between the trader’s number and the underlying physics opens up. That gap is where the steady money lives.
At what exit velocity does a batted ball become likely to be a home run?
The 98 mph threshold is the formal lower bound for a barrel – the contact category that converts to home runs at the highest rate. Below 98 mph, only specific launch angles produce home runs and only with environmental help. Above 110 mph, virtually any reasonable launch angle becomes a home run threat. The hitters with elite 90th percentile exit velocities are the ones who consistently reach the velocity bands where home runs become probable.
Should I focus on a hitter’s average or maximum exit velocity?
Neither in isolation. Average exit velocity tells you how hard the hitter typically connects and is stable but smoothed. Maximum exit velocity tells you the ceiling but is sample-dependent. The 90th percentile reading sits between them and is the most predictive of home run output, because it captures how hard a hitter strikes his best contact, which is where homers actually originate.
Created by the ”mlb Prop Bets Home Runs” editorial team.